- The Nasdaq hit an all-time high on 6 October and is down 16% just over a month later. Semiconductors and South Korea, up around 100% in three months earlier this year, have given back almost all of it.
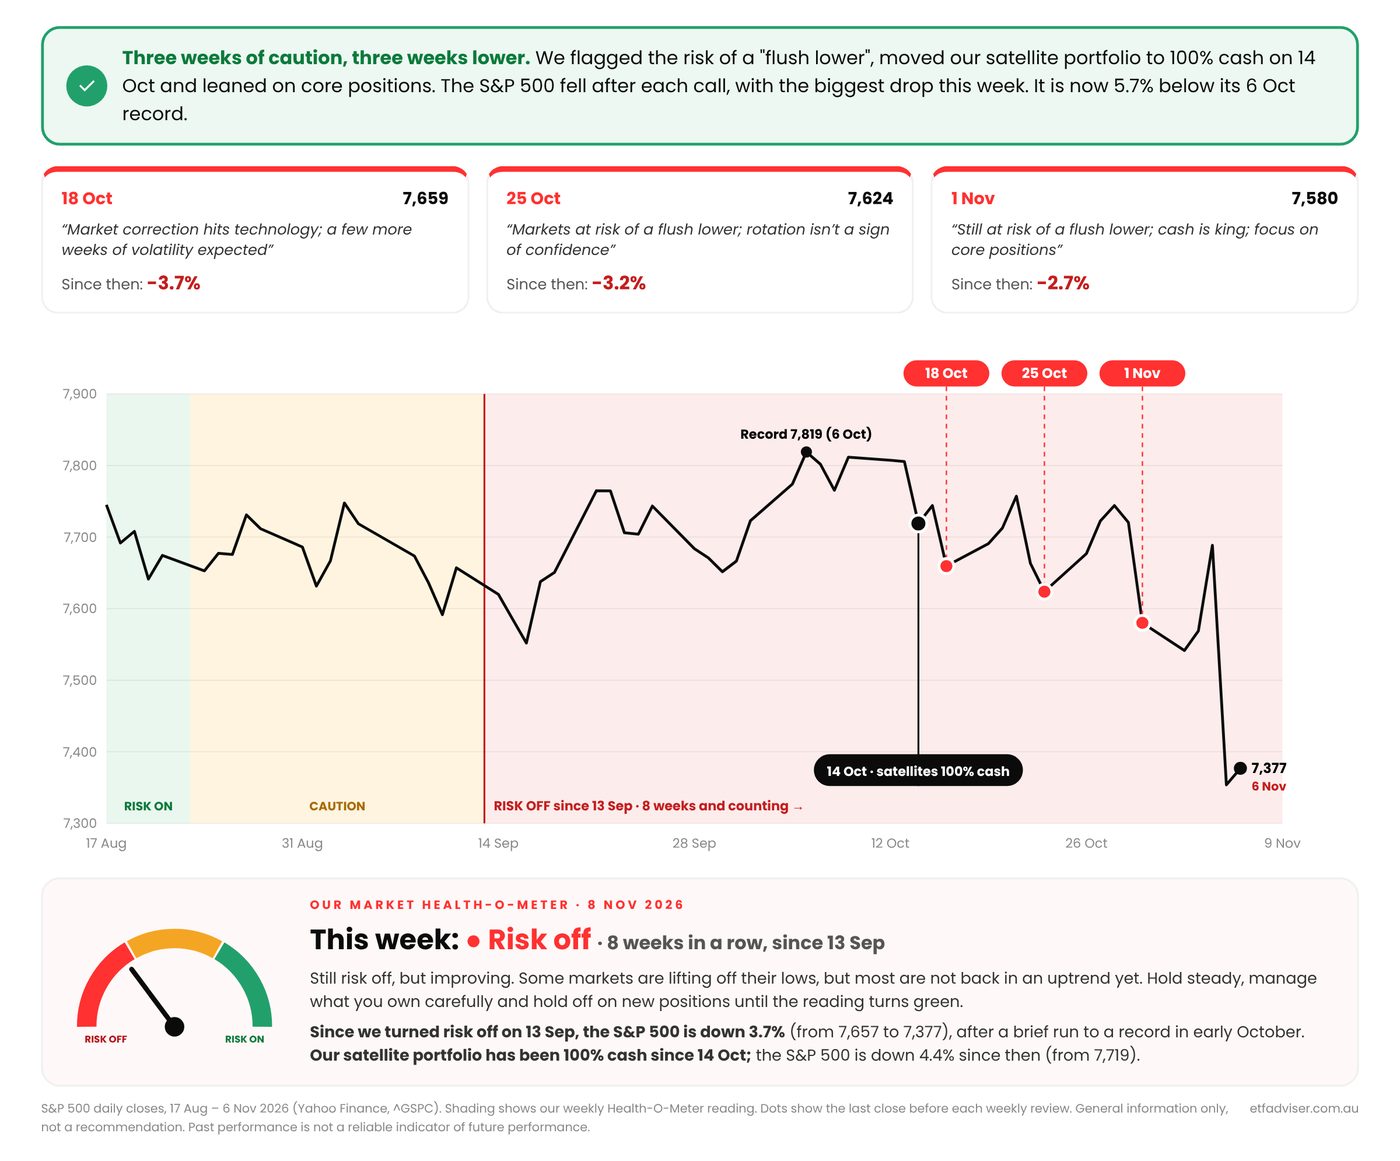
- No surprise to our members: we turned risk off on 13 September, moved our satellite portfolio to 100% cash on 14 October and warned of a downside flush.
- The Aussie market and our diversified core ETFs are holding up. Money is hiding in defensives like banks and healthcare: don’t chase them.
- Early signs of capitulation: record put buying, record selling in leveraged ETFs and US valuations back below their 10-year average. We need more data before the cash goes back to work.
Is the AI trade over?
What a market. On 6 October the Nasdaq hit an all-time high. Just over a month later, it’s down 16%.
The AI darlings have been hit hardest. IKO (South Korea) and SEMI (semiconductors) rose around 100% in about three months earlier this year, one of the biggest momentum rallies in history, only to give back almost all of it in the last few months.
Why this was no surprise to us
- Our Market Health-O-Meter turned risk off on 13 September, three weeks before the Nasdaq peaked.
- Our satellite portfolio went to 100% cash on 14 October, a week after the high.
- For the last two weeks we’ve said one thing: watch for a downside flush. That’s exactly what we’ve had so far.
But remember, the best opportunities don’t come at the top. They come after corrections like this, when good ETFs go on sale and prepared investors get to buy at much better prices. So this week is about getting ready: the signs the opportunity is coming closer, and the warning signs that more downside is coming.
Nasdaq: the line in the sand
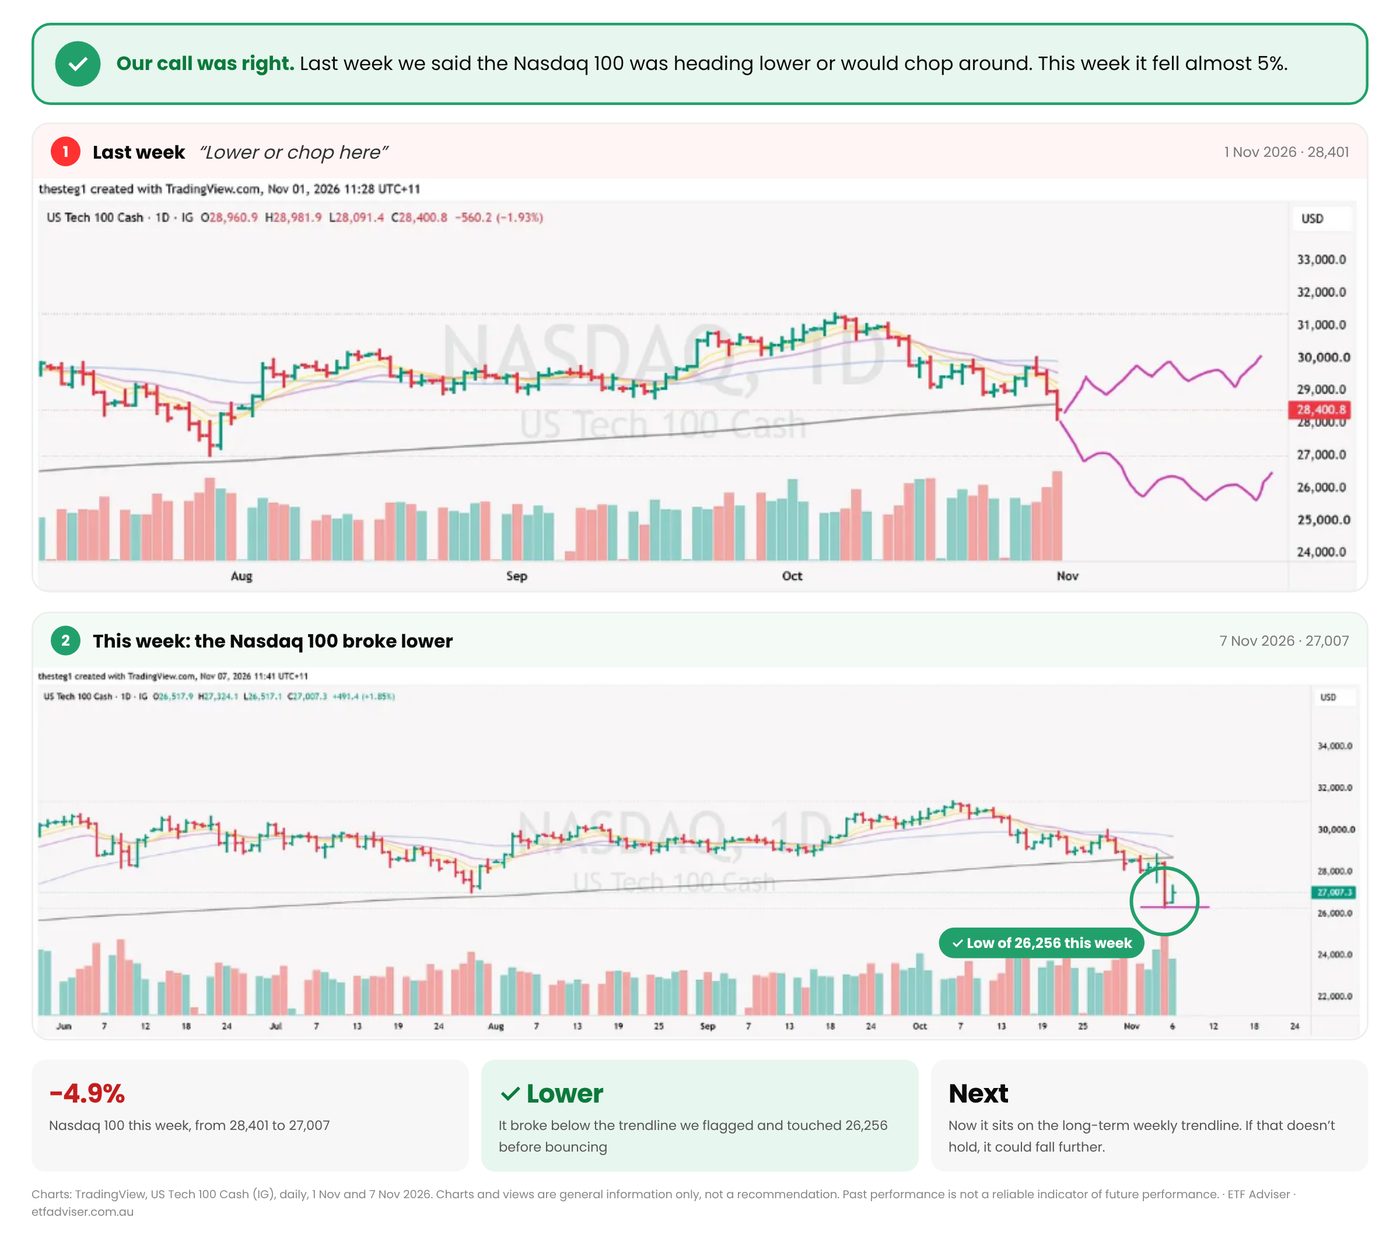
It’s been incredibly volatile. On the chart the Nasdaq is already around 14% off its early-October high, and well under its 200-day moving average. We’re not 100% sure it’s over yet. This low is the line in the sand: if it can’t hold and find support, we could go much lower before we find the eventual low. It’s all about watching the market and seeing what happens.
The Aussie market is holding up
While the US market has given up, the surprise has been the Aussie market. It’s holding up incredibly well: above all its moving averages, including the 200-day, and not far from its all-time highs. That resilience is something we want to see continue.
Why our core portfolios are holding up
Our satellite portfolio is 100% cash because the market is just too choppy. But our core, which uses diversified ETFs, has stayed fully invested and is holding up well. VDAL is holding above its 200-day moving average, helped by its exposure to Australian shares. If it were a global-only fund, it would be selling off and sitting below its 200-day average.
Once a diversified ETF holds more defensive assets, it’s a different story. VDGR, with around 30% in fixed interest and other defensive assets, is trading under its 200-day average. That’s why we’ve been talking to subscribers about staying more allocated to growth-style investments and holding a cash buffer, because fixed interest isn’t really acting as a defensive asset in today’s global conditions.
Asia: China, Hong Kong and Japan
China has been incredibly weak, with no buying on the weekly chart. It’s now very extended to the downside, so it’s at risk of an upside flush if any data out of China springs the market back into action. Hong Kong has moved a little, which is a good sign, but it’s still under its 200-day average. Japan has fallen five weeks straight and is now under its 200-day average. There was good buying on Friday: is that the low, or does it need to flush out further? Japan is an interesting market to watch this week.
Semiconductors and South Korea give back their gains
The real leader this year was the semiconductor trade, and South Korea was a big beneficiary. Both moved over 100% in just a couple of months, and both have now almost retraced that entire move. It shows why you can’t just stay fully invested in big movers: you need to know when to take profits, or you can give back a great gain for the rest of the year.
It’s not just South Korea. ASIA, the Betashares Asia Technology Tigers ETF, looks almost identical. Even a fund you might think of as diversified across Asia can have a large exposure to the semiconductor trade, so know what’s inside your ETFs.
Aussie tech, banks and healthcare: don’t chase
Back home, we’re seeing a different move to the rest of the world. ATEC, the Aussie tech ETF, is finally back above its moving averages after a big 40% correction. It was a positive sign late in the week, and Aussie tech is well advanced in its correction compared with overseas.
People have been piling into the banks, but that’s not something to chase. There’s real risk in these defensive trades, and as the market bottoms you’d expect defensive-style trades to sell off. The same goes for healthcare: global healthcare (IXJ) is at or near all-time highs after an almighty run. It would actually be a good sign if it sold down at the same time the market finds a low, because everyone is hiding in defensive names right now.
Signs of rotation in the Aussie market
What I liked is that we’re starting to see buying outside financials and resources. We judge that with OZXX, the Aussie market excluding banks, BHP and Rio. It had a 20% correction from August last year, has been bottoming, and is now back above its moving averages. That’s a positive sign of rotation after what was already a bear-market correction.
Our Market Health-O-Meter
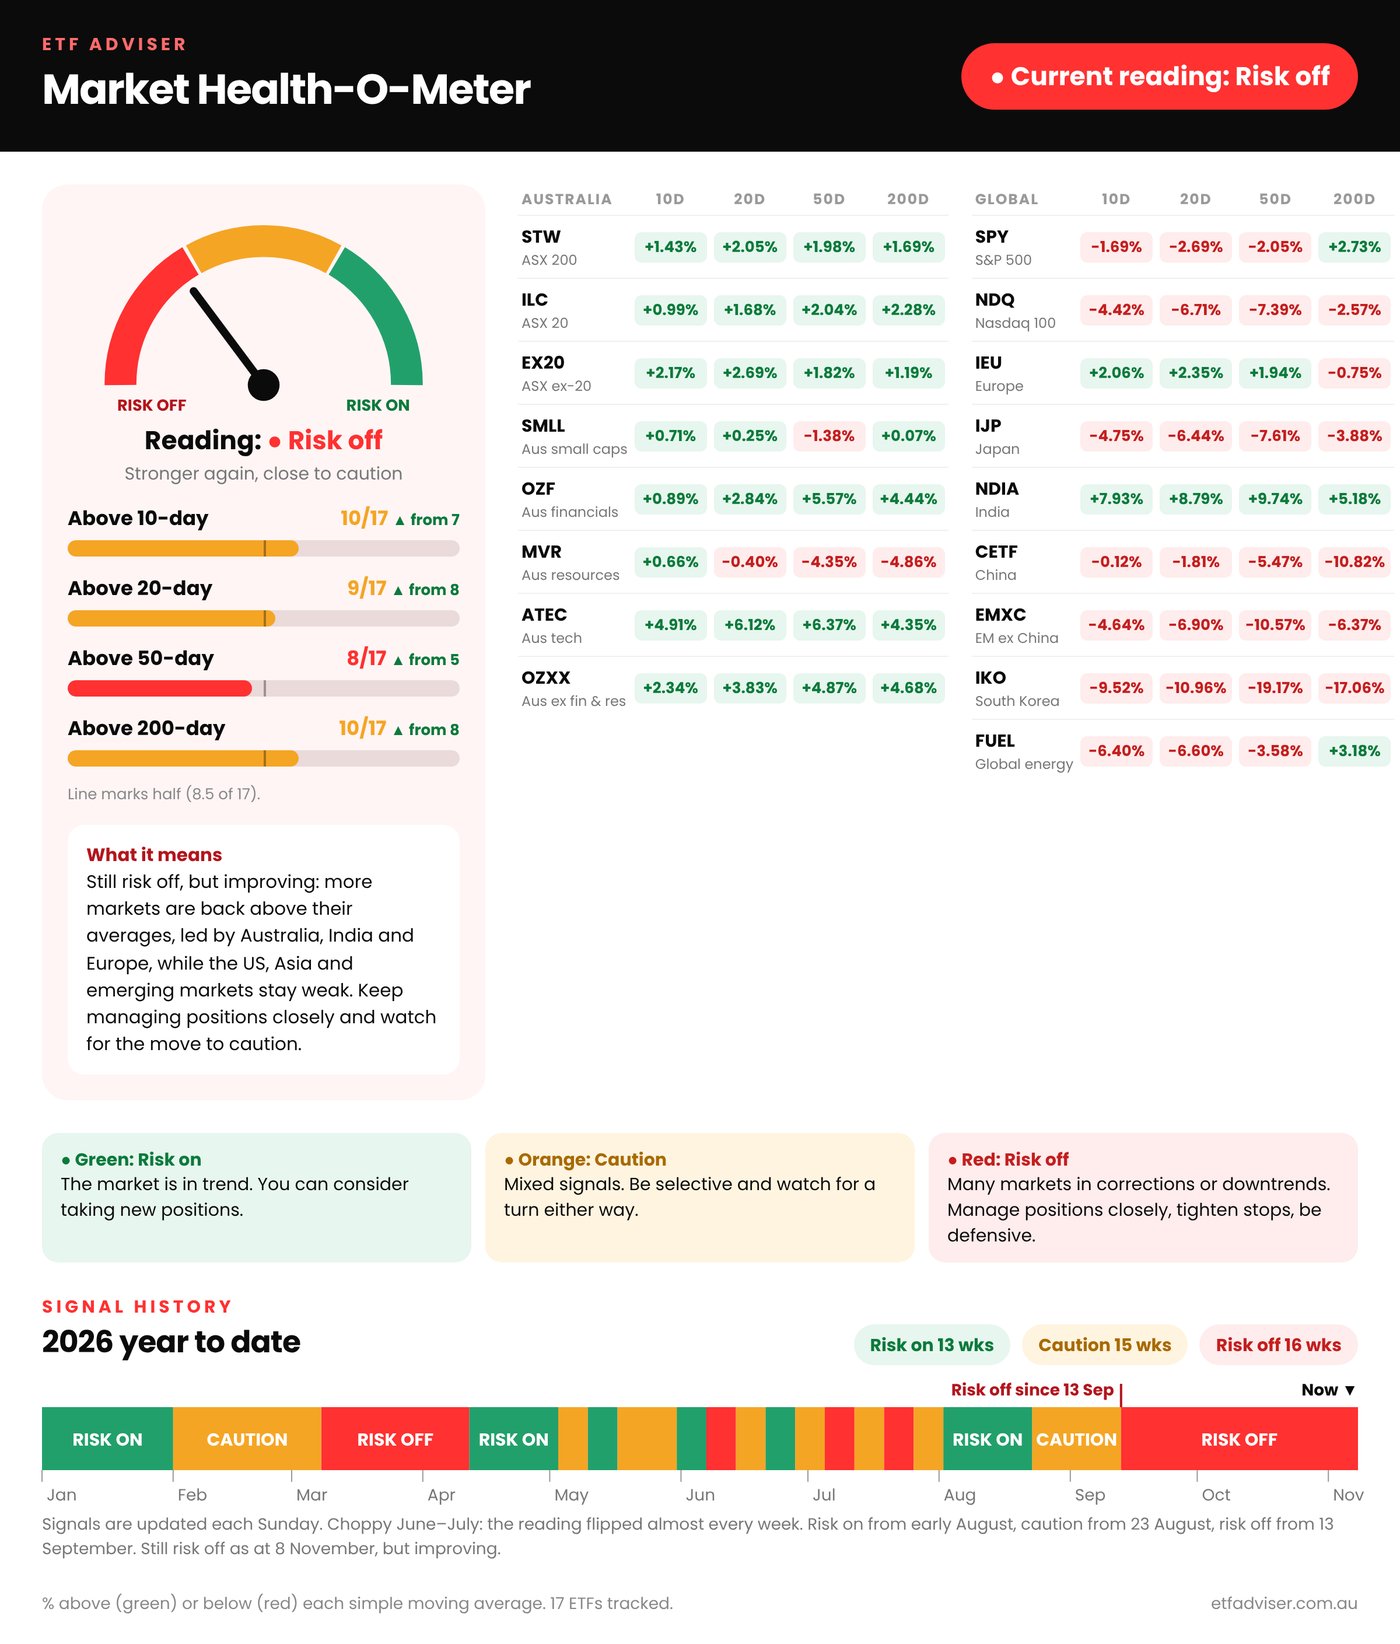
So how do we know when it’s a good time to get back into the market? We look at our data-driven indicators, starting with the Market Health-O-Meter, which is built for Australian investors. Interestingly, almost all the green is coming from the Aussie market.
That’s lifted our risk reading off “extremely red” and towards orange. More of the big indexes are now above their 10-day, 20-day and 200-day averages, but the 50-day reading is still red, so our overall reading is still risk off. We want to see the bigger markets join the party before we get more optimistic.
Key ideas: zero for two weeks
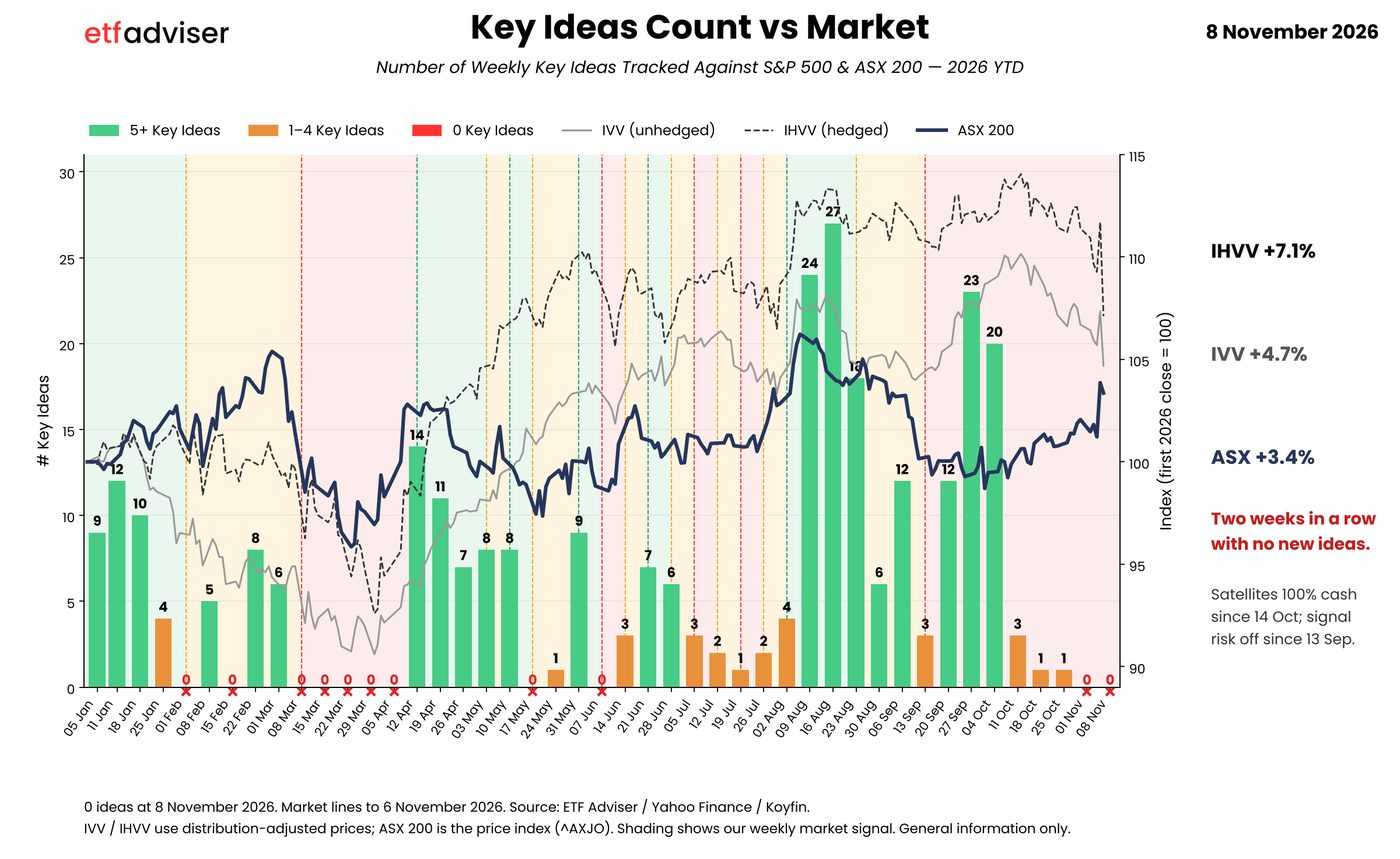
We also track how many ETF ideas are setting up each week. For the last two weeks it’s been zero: things are just too volatile. In mid-August we had 24 and 27 potential buy ideas in a week. When that number starts to creep up again, it’s another sign the market is bottoming and the opportunities are presenting themselves, and with our satellite portfolio 100% in cash, we’ll be ready.
How our members stay ahead
When this correction ends and the Health-O-Meter turns green, how will you find out? The day it happens, or a month later when the bounce is in the headlines and the best prices are gone? Every week, members get the Market Health-O-Meter, our core and satellite model portfolios with every buy and sell as it happens, our key ideas list and our full weekly review. Try it free for 30 days.
Where the money is flowing, and why not to chase it
A lot of money has gone into defensive assets: financials in Australia and global healthcare. Money has also flowed back into India, which looked weak a week ago and has just had a big move back above its 200-day average, though it’s still in a big base. Money is looking for markets that have already sold off and look cheap.
The classic case for not chasing is HACK (cybersecurity). It broke out and looked very strong, but the move was V-shaped in a very weak market, and it quickly gave it all back to the buy point. INCM (global dividend aristocrats) has had a big move as money hides in dividend-paying companies. It’s now extended well above its 50- and 200-day averages and at real risk of a pullback, which could set up a buy point later. Some parts of the market are at or near all-time highs, but our indicators say stay in cash and don’t chase extended moves.
Gold, copper, zinc and resources
- Gold was threatening to break down but found some buying last week. If that low can’t hold, it will go much lower. Gold miners ETFs still look weak, but they didn’t make a new low like the gold price, a sign of relative strength that could set up later.
- Copper sold back to its 200-day average, as we flagged. It had been too strong compared with the rest of the market, and the 200-day acts like a magnet.
- Zinc is holding up well on its 20-week average in a big weekly base, probably one of the best commodities out there, but it’s also at risk of a pullback to the 200-day.
- MVR (Aussie resources) sold off quickly and is at the bottom of its base. We want that to hold this week. If it breaks, it goes lower. Resources have been a tough trade all year, so they may be further through their correction than tech.
US banks, small caps, volatility and oil
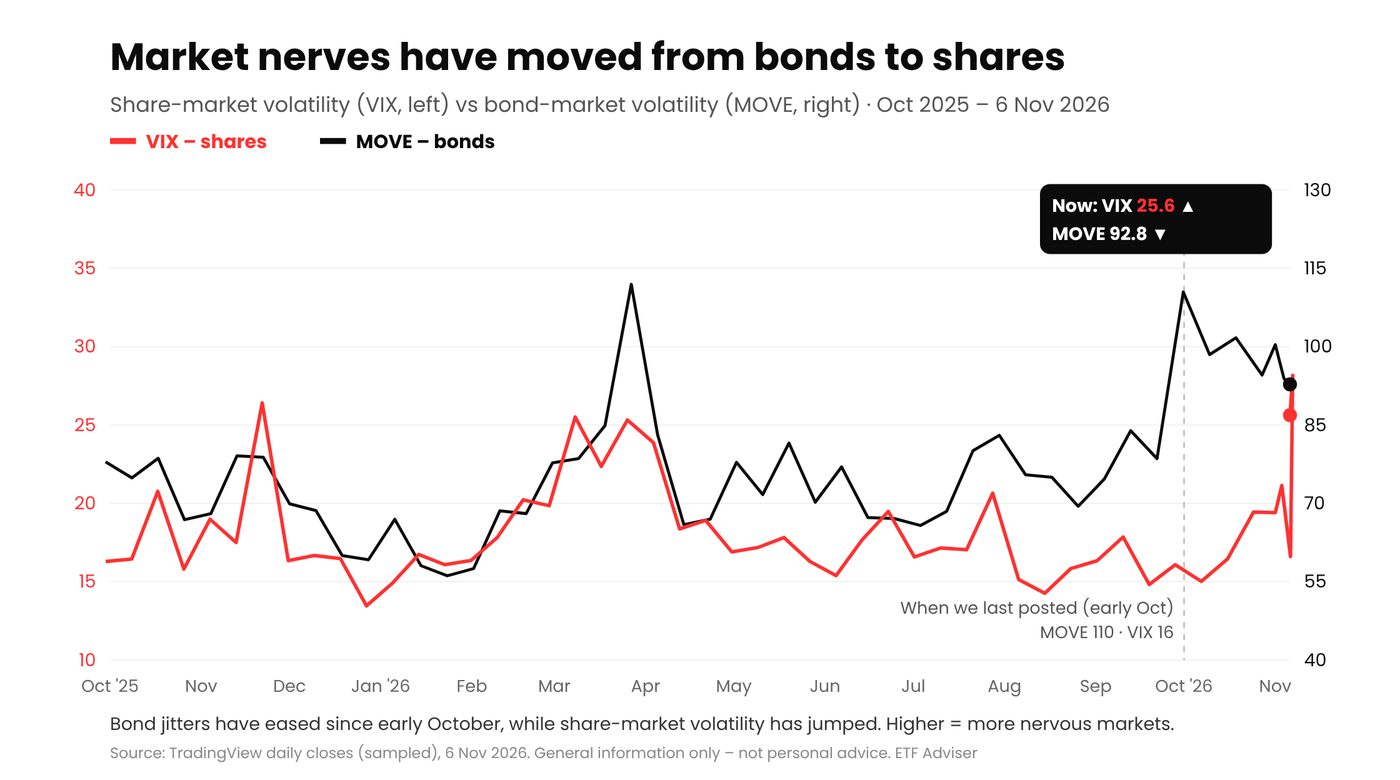
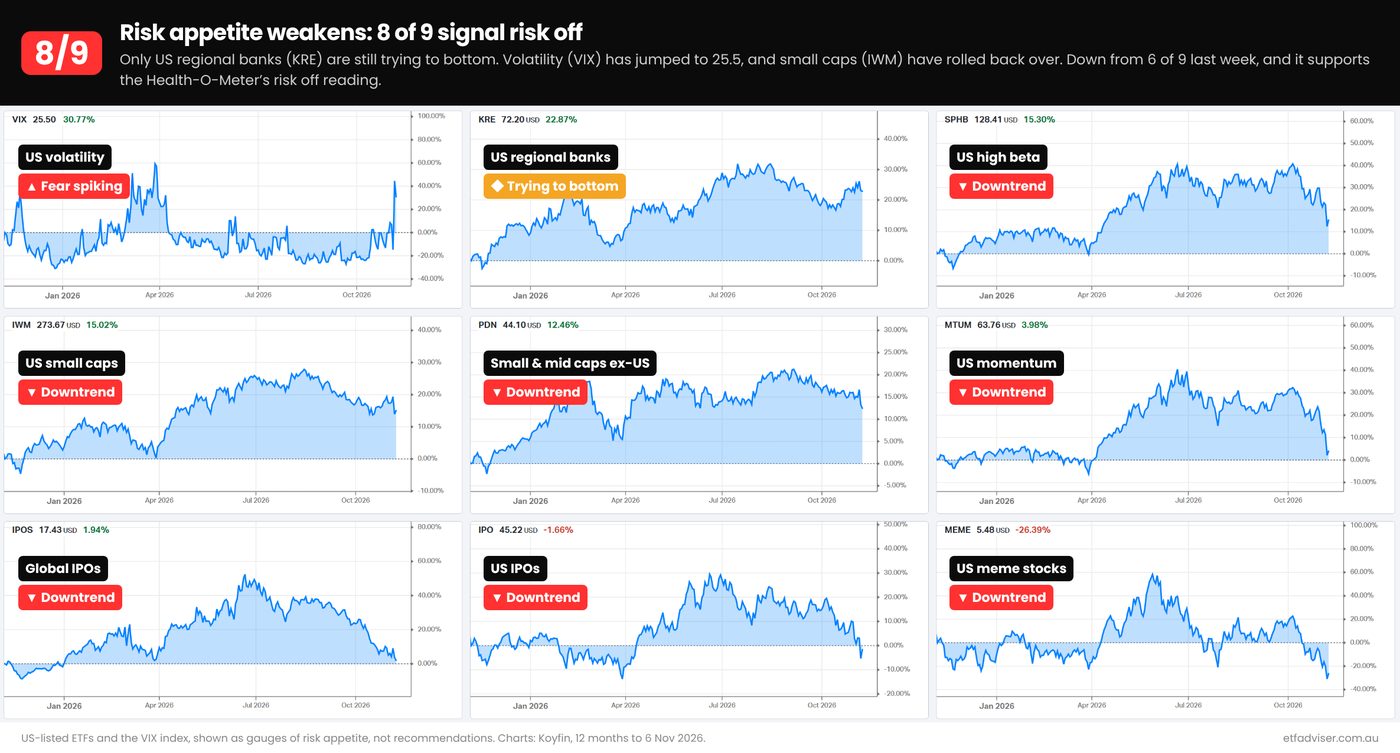
US regional banks are holding their lows and are back above their moving averages, a sign things may not be as bad for the US financial sector and economy. Small caps are right on the edge and not giving much guidance. Bond-market volatility (the MOVE index) spiked first and has settled back, and now the VIX has followed with a big spike. Usually we need that spike to find a low: is it enough, or does it need to go higher?
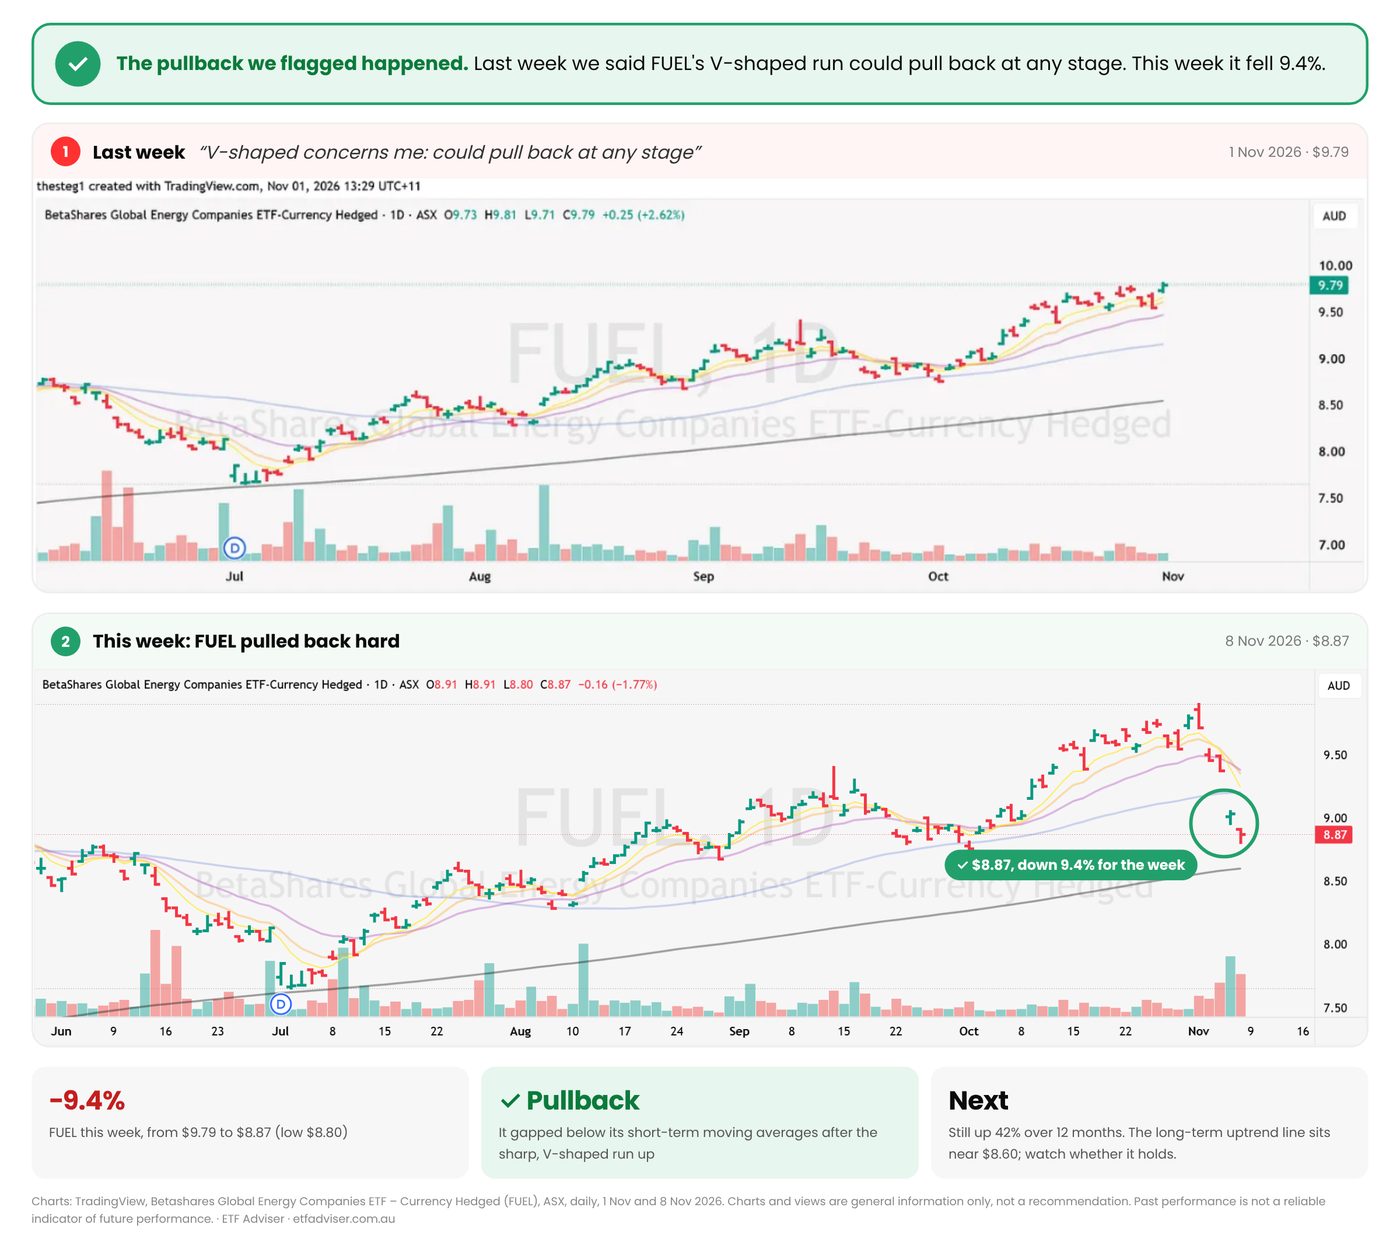
Oil looks to be topping out, which would be a positive for the global economy. It’s another reason we weren’t chasing. FUEL (global energy, hedged) had a nice breakout but was extended against the rest of the market, and in one week gave back several weeks of gains. When markets are this volatile, with this many conflicting signals, the key is to hold cash, be patient and let the setups come to you.
Signs of capitulation
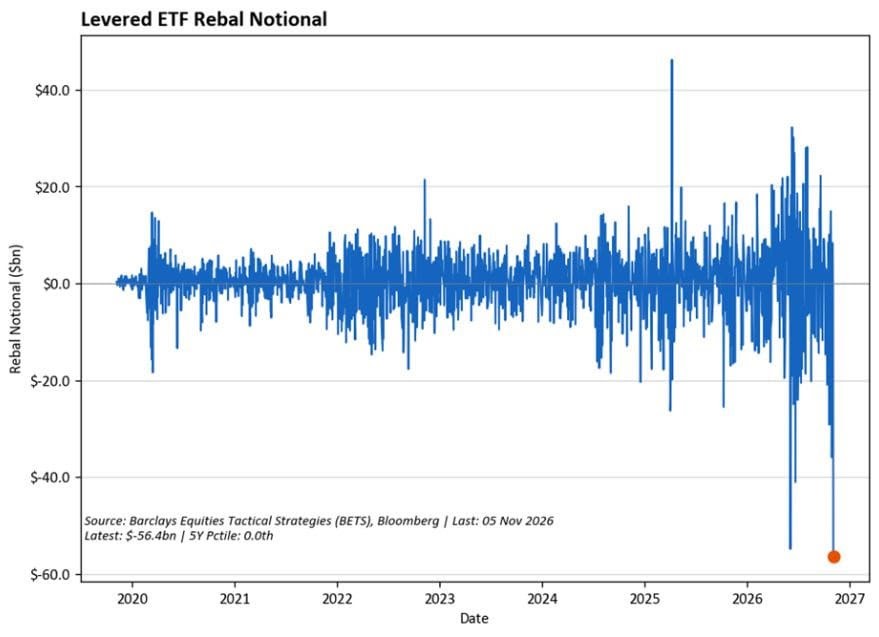
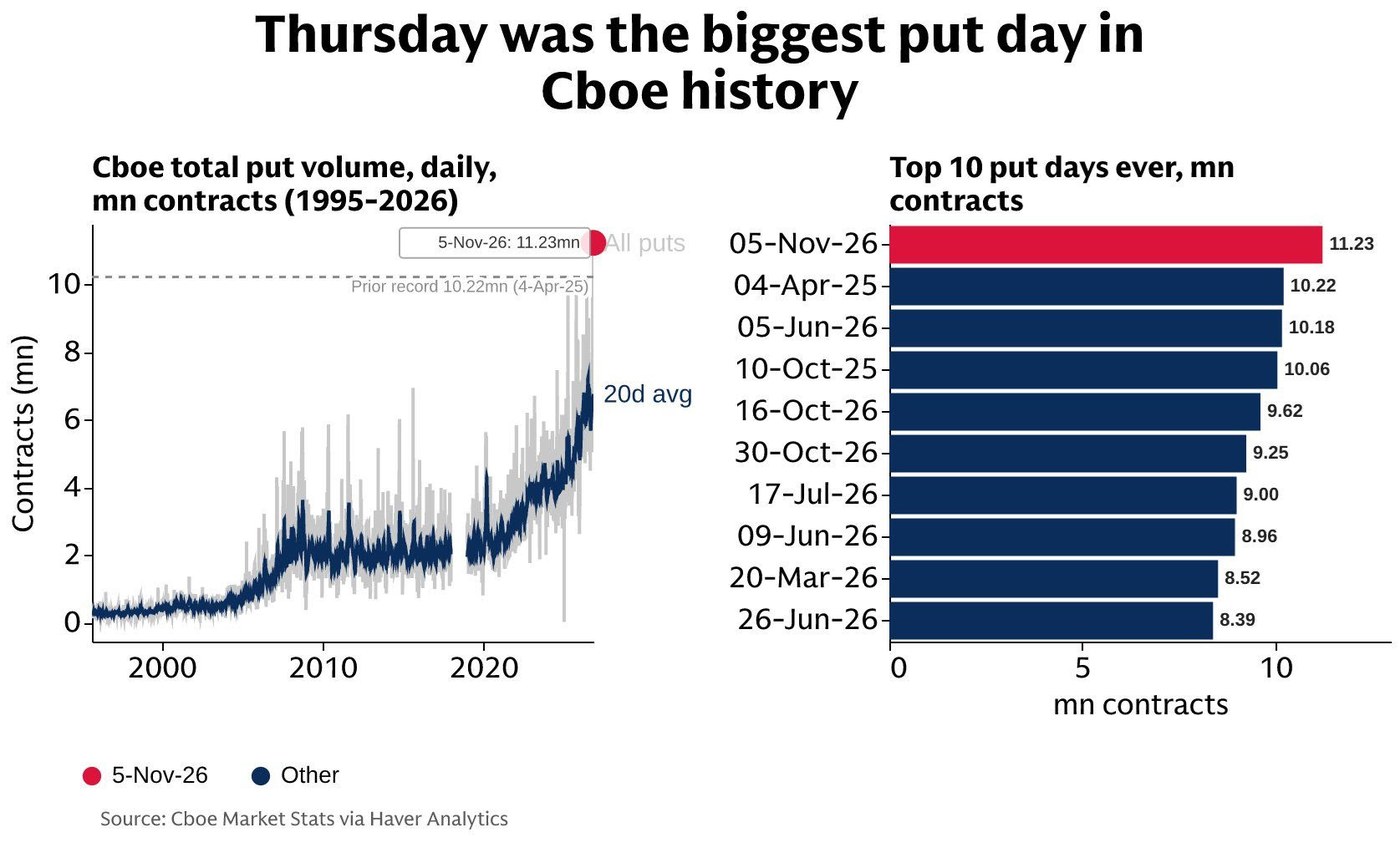
There are some initial signs of bottoming. We want to see panic and people giving up: capitulation is what a market bottom looks like.
- Record selling in leveraged ETFs in the US, about US$56 billion in a day.
- The biggest day for put options in history: about 11.2 million contracts on 5 November. Puts are basically portfolio insurance.
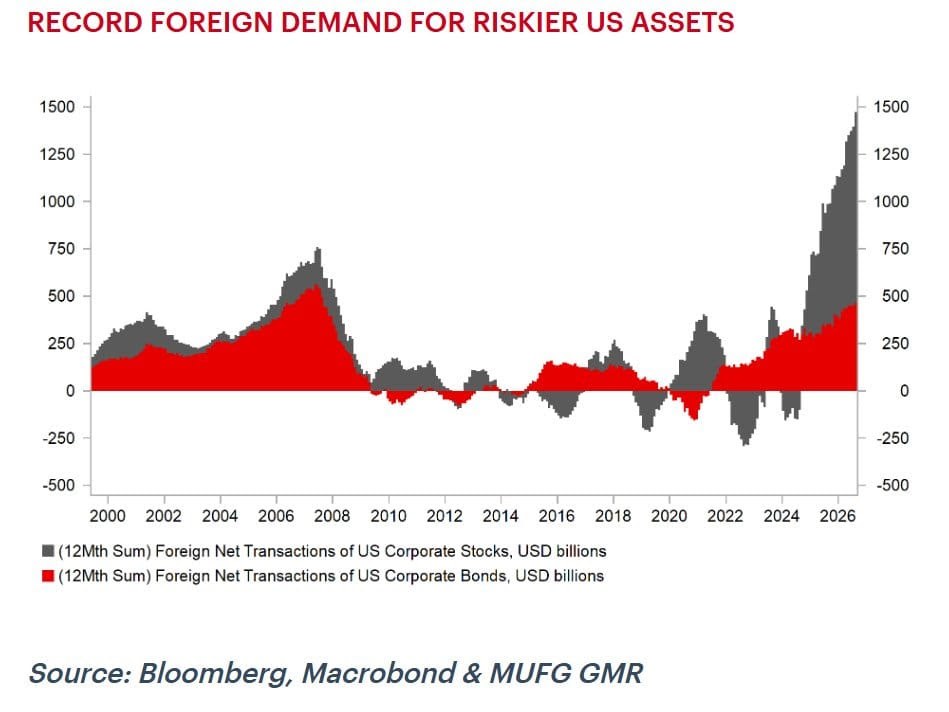
- Money is still flowing into the US, with record foreign buying of US shares and bonds, so the US is likely to remain the place to be.
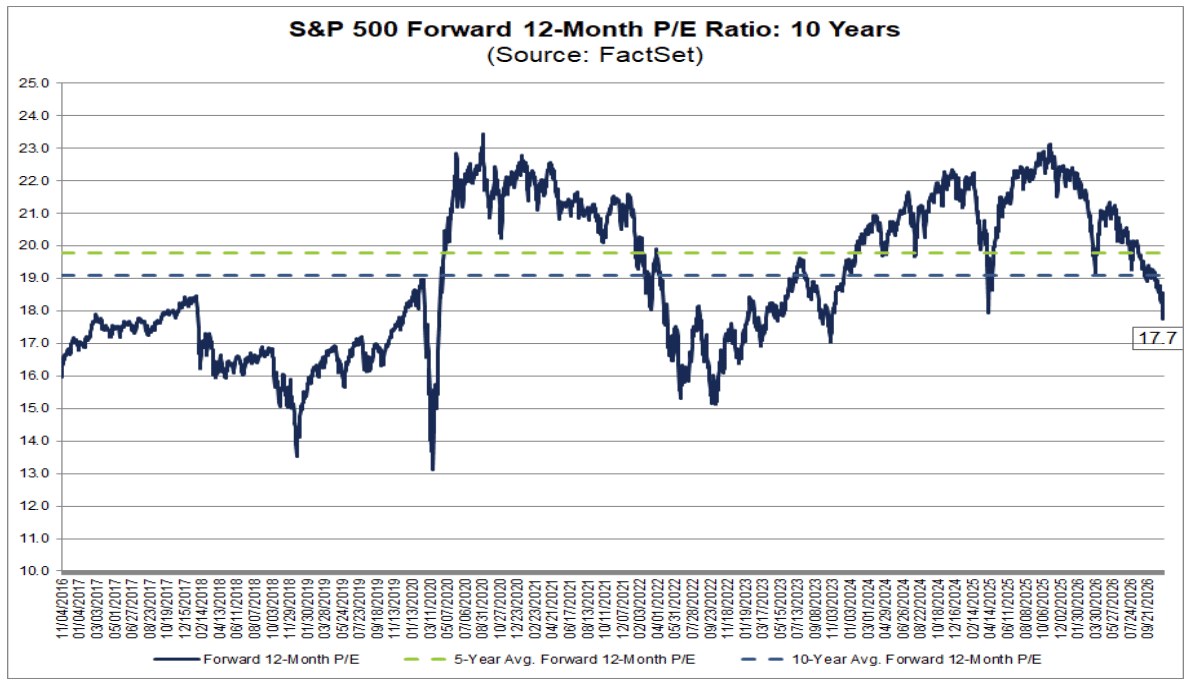
- Valuations have come off: the S&P 500’s forward price-to-earnings ratio is about 17.7, below its 10-year average.
These are good signs, but we need more data.
Our plan from here
The AI trade has been hit hard, and this wasn’t a surprise. Now the question isn’t “should I panic?”, it’s “am I ready?” Fear is at record levels, US shares are the cheapest they’ve been in about three years, and when the selling runs out, good ETFs will be on sale. Our plan is simple:
- The core stays invested unless it breaches its 200-day averages and recent support. That’s what we’re watching this week.
- The satellites stay in cash until the Health-O-Meter turns green and our other data points improve, including the number of key ideas.
- We don’t chase the defensive ETFs that have already run. HACK and FUEL show why.
- Our shopping list is ready, so when the signal comes, we act with a plan, not emotion.
ETF Adviser Lite and Complete
Lite ($15 a month) is for investors new to ETFs: a weekly report with our key indicators, including the Market Health-O-Meter and core ETF check-up. Complete ($40 a month) adds our full weekly report, the subscriber-only mid-week video and our model portfolios with every buy and sell. Both include the live YouTube Q&A every Thursday at 7:45pm, and both come with a free 30-day trial.
General information only, recorded at the date shown. Market views can change quickly. Mentions of ETFs, indices and portfolio positioning are not recommendations and don’t consider your objectives, financial situation or needs. Past performance is not a reliable indicator of future performance.