VDGR is an all-in-one ETF that holds about 70% shares and 30% bonds, rebalanced for you. It charges 0.27% a year, has $1.6b invested and returned +5.6% over the past year. The most similar ETF is VDBA, which overlaps with it by about 67%.
📅 As at 30 September 2026: fee, size and 1-year return from the TMX Australia funds report; holdings and overlap from VDGR’s published holdings as at 30 September 2026.
Is it a good time to buy VDGR?
Nobody can time the market perfectly, but you can check the trend before you buy. Here’s where VDGR stands right now.
Loading…
| Net flow, September | +$33m |
| Net flow, 2026 so far | +$268m |
| Average month in 2026 | +$30m |
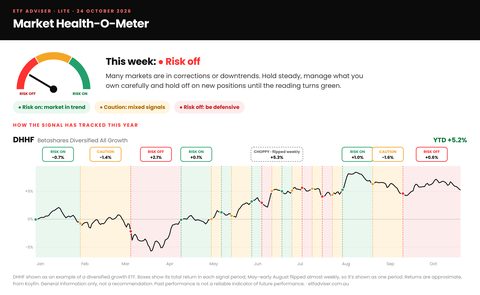
Is the whole market risk on, caution or risk off this week? Members see it every Sunday, with the core ETF check-up.
 🔒 See it free for 30 days →
VDGR is in a base. Prices moving sideways can be a time to build a position gradually and watch which way the trend breaks. There’s no rush either way.
General information only, not a recommendation to buy or sell VDGR. Whether it suits you depends on your goals and the rest of your portfolio. Trend updated weekly; flows from the TMX Australia funds report (September 2026) and the Global X weekly market monitor. See every ETF’s trend in the ETF trend scanner, or read when to buy an ETF.
What is VDGR?
Index: A mix of Vanguard index funds (about 70% shares, 30% bonds) · Distributions: Quarterly · Issuer: Vanguard · Exchange: ASX
Top 10 holdings
The 10 largest companies make up 16% of VDGR.
| # | Company | Weight | |
|---|---|---|---|
| 1 | BHP Group LtdMaterials | 3.09% | |
| 2 | Commonwealth Bank of AustraliaFinancials | 2.53% | |
| 3 | NVIDIA CorpInformation Technology | 1.93% | |
| 4 | Apple IncInformation Technology | 1.80% | |
| 5 | Microsoft CorpInformation Technology | 1.33% | |
| 6 | Alphabet (Google)Communication Services | 1.33% | |
| 7 | National Australia Bank LtdFinancials | 1.22% | |
| 8 | Westpac Banking CorpFinancials | 1.20% | |
| 9 | ANZ Group Holdings LtdFinancials | 1.16% | |
| 10 | Amazon.com IncConsumer Discretionary | 0.89% |
Sector breakdown
ETFs most similar to VDGR
How much each ETF’s holdings overlap with VDGR, by weight. High overlap means owning both mostly doubles up.
| ETF | Overlap | |
|---|---|---|
| VDBAVanguard Diversified Balanced Index ETF | 67% | Compare in calculator → |
| VDHGVanguard Diversified High Growth Index ETF | 61% | VDGR vs VDHG → |
| IBALiShares Balanced Esg ETF | 54% | Compare in calculator → |
| VDCOVanguard Diversified Conservative Index ETF | 52% | Compare in calculator → |
| VDALVanguard Diversified All Growth Index ETF | 51% | Compare in calculator → |
| DHHFBetashares Diversified All Growth ETF | 51% | Compare in calculator → |
Head to head: VDHG vs VDGR · all comparisons
Check VDGR against your own ETFs →Core or satellite?
CORE All-in-one (diversified)
VDGR is a core holding on its own. Read more in core and satellite investing.
Read more: VDHG vs VAS and VGS · ETFs for retirement
VDGR FAQs
Is VDGR a good ETF?
VDGR is a simple, diversified all-in-one ETF for investors who want less volatility than an all-shares fund. Expect lower long-run growth in exchange. Whether it suits you depends on your goals and the rest of your portfolio.
What does VDGR invest in?
VDGR is an all-in-one ETF that holds about 70% shares and 30% bonds, rebalanced for you. Its largest holdings are BHP Group Ltd, Commonwealth Bank of Australia, NVIDIA Corp, and its biggest sector is bonds and cash at about 37%.
What ETFs are similar to VDGR?
The ETFs with the most overlap with VDGR are VDBA (about 67%) and VDHG (about 61%). Use the free ETF overlap calculator to check your own mix.
How often does VDGR pay distributions?
VDGR pays distributions quarterly.
Should I own VDGR and VDBA together?
Usually there is little point: their holdings overlap by about 67%, so owning both mostly doubles up.
Fee, size and returns: TMX Australia Funds Report to 30 September 2026; returns are total returns, 5-year figure is cumulative. Holdings from Vanguard as at 30 September 2026; sector split based on the holdings we can see, about 81% of the fund. Chart: TradingView. General information only, not a recommendation to buy or sell VDGR. Consider the PDS and TMD before investing.