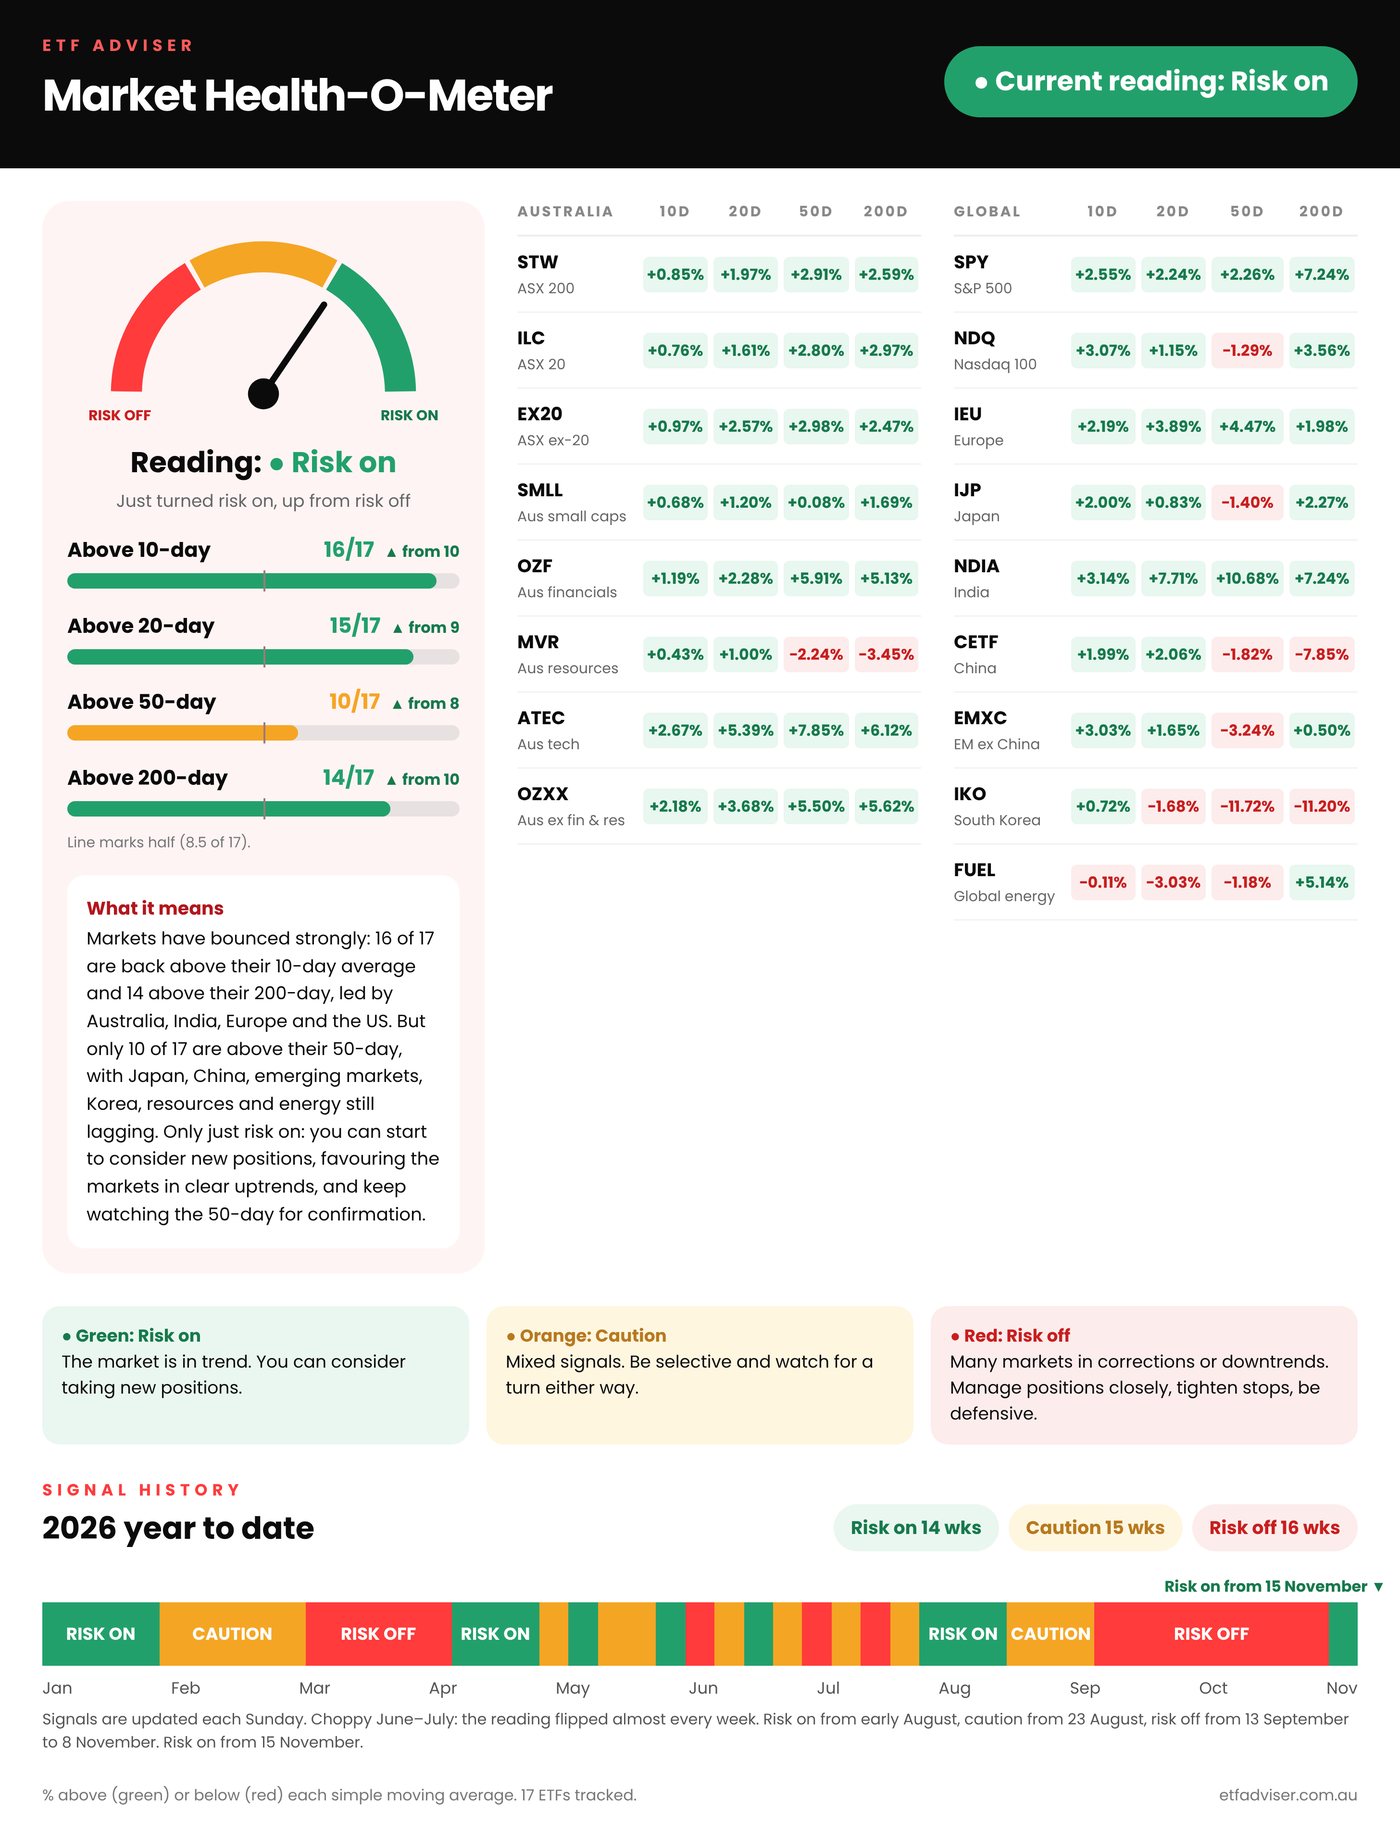
- Our Market Health-O-Meter turned green for the first time in nine weeks, mostly thanks to the Aussie market.
- But our US risk on/off gauge is still red and we have no key ideas for the third week, so the satellite stays 100% in cash and the core stays fully invested.
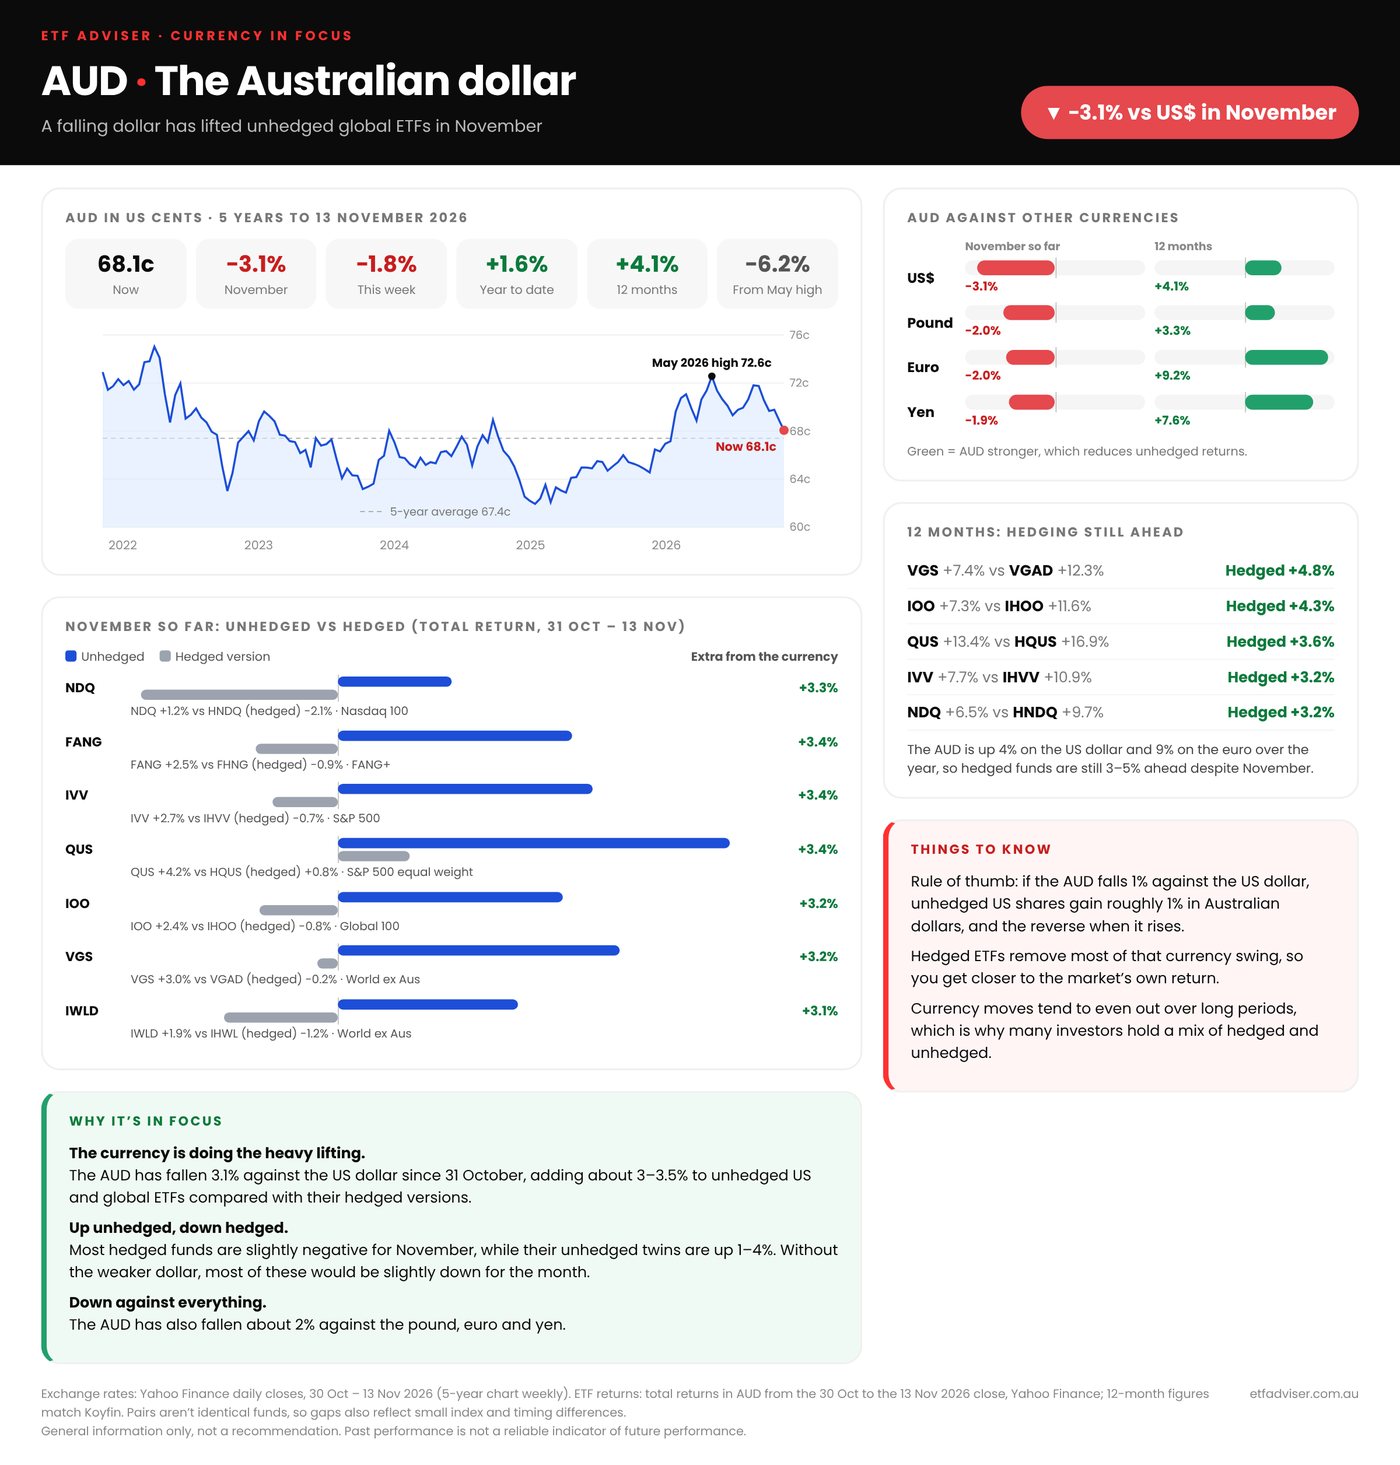
- Two things are fooling investors: a rush into big, defensive stocks, and a weak Aussie dollar making unhedged global ETFs look stronger than the markets underneath.
- New free tool: X-ray your ETF portfolio on ReviewETF, down to the dollar.
Our signal turned green, but all is not what it seems
Our Market Health-O-Meter has turned green for the first time in nine weeks. We’ve been firmly risk off since 13 September: our core stayed fully invested, but our satellite portfolio has been 100% cash since 14 October.
Last week the meter crept into neutral, driven mostly by the Aussie market indices, which are now all above their moving averages. This week it ticked into green as global indices, including the US, showed some strength too. But all is not what it seems, and we have two other signals we check before we put money to work.
US risk on / risk off: still red
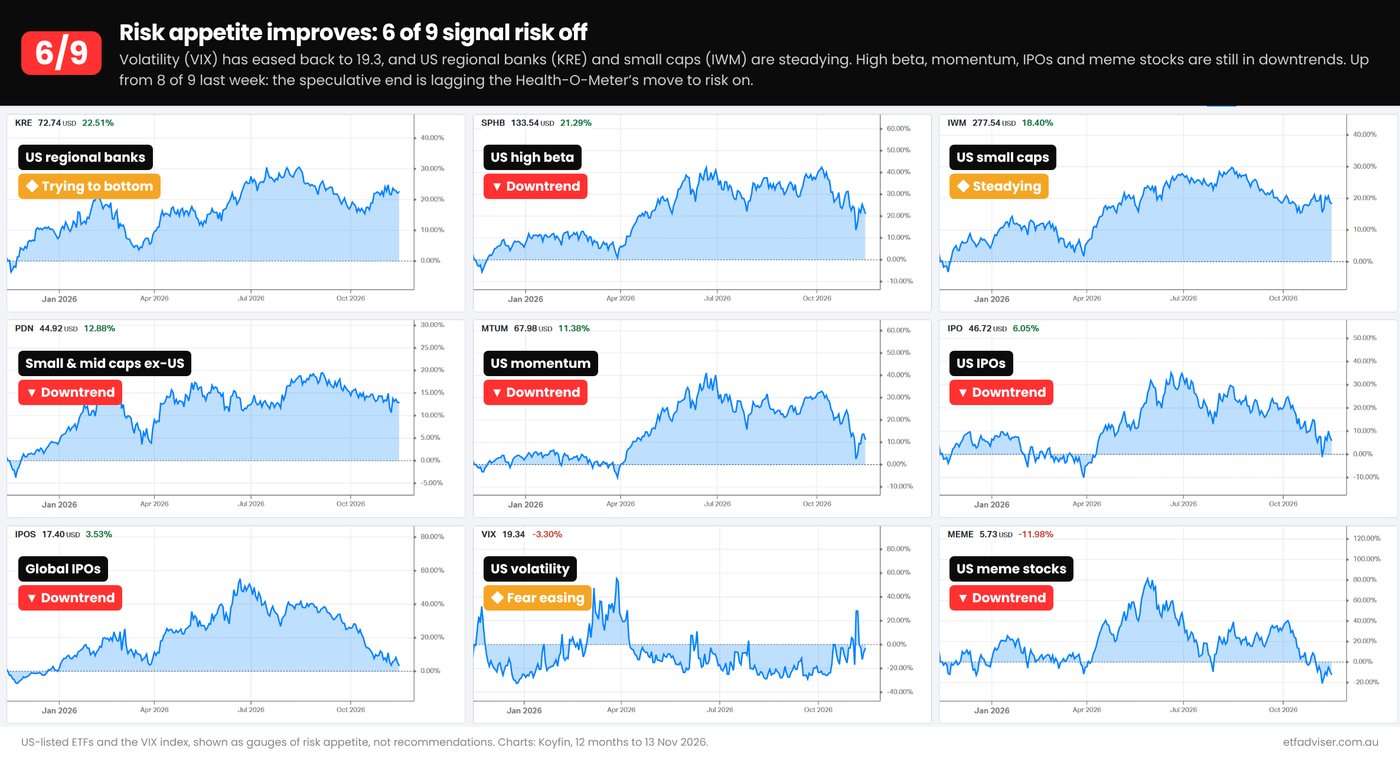
Our second signal is a gauge of nine US-listed ETFs that show how much risk investors are willing to take: US regional banks, mid caps outside the US, US momentum, US and global IPOs, volatility, meme stocks, small caps and high beta.
It’s still red. Only a few are showing some basing action, and the rest are still in downtrends. That tells us to stay incredibly cautious.
No key ideas for the third week
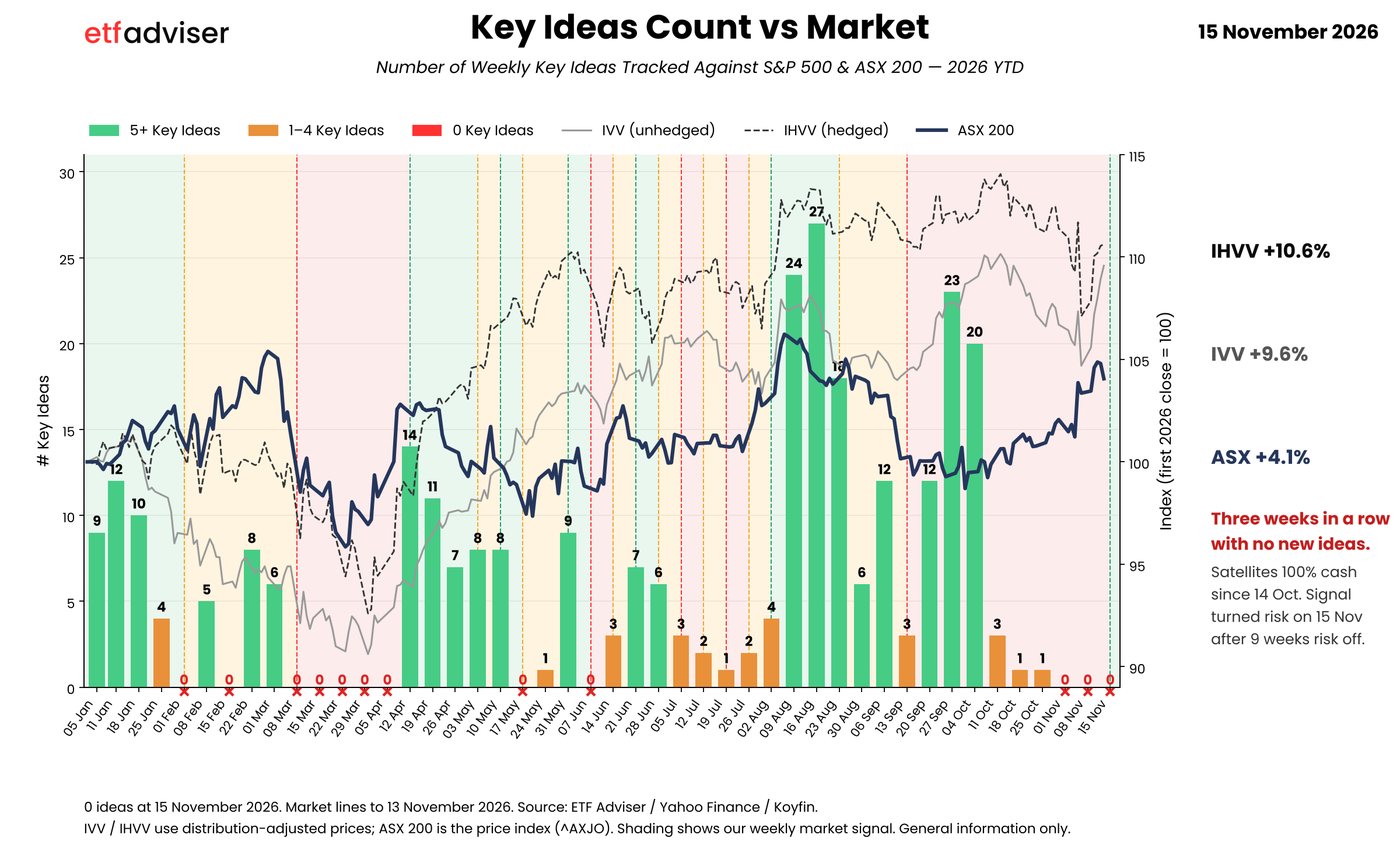
Our third signal is the number of key ideas: new ETFs setting up that we’d look to buy for the satellite portfolio. For the third week running, we have none. In mid-August we had 24 and 27 in a week.
Until the key ideas start to pop up again, and the US risk on/off gauge improves alongside the Health-O-Meter, we don’t want to put our satellite cash to work.
New free tools: X-ray your ETF portfolio
On ReviewETF, our ETF comparison site, there’s a free My Portfolio tool. Enter your ETFs, and any ASX shares you hold, and work through the tabs:
- Performance against a diversified core like DHHF and the Aussie index (A200)
- Look-through: what you actually own, by company, country and sector, compared with the ASX 200, VGS and DHHF
- Overlap between your ETFs. In the example in the video, DHHF and A200 overlap by about 37%, and DHHF and IVV by about 35%.
- Fees, including any cheaper ETFs that are the same or very similar
- Income: when your distributions have been paid in the past
At the end you can download a full X-ray report, around 23 pages, showing what you hold right down to the company, in dollars. The most common problem we see is overlap: several similar ETFs that don’t add value, instead of a clear core and satellite approach.
The weak Aussie dollar is fooling investors
This is the one most people are overlooking. The Aussie dollar has fallen sharply against the US dollar over the last two weeks, and that’s throwing things out.
International ETFs bought on the ASX look strong and look like they’re breaking out, but a large part of that move is currency. IVV on the ASX is close to its highs after a V-shaped bounce. The US-listed IVV, in US dollars, is nowhere near its highs and looks a lot weaker. That makes it hard for Aussie investors to judge whether the market is really pushing to new highs, or still needs to find a proper bottom.
It works in our favour in the core. Diversified ETFs like DHHF are almost back at their highs, partly thanks to the weaker dollar, which is why the core stays fully invested.
A strong US dollar, Bitcoin and gold
The US dollar is incredibly strong, the strongest it’s been since early 2025. That dampens confidence: people just want US dollars, and it’s a real drag on money flowing into commodities.
- Bitcoin has taken another big dive, almost back to its lows after about six weeks down. Ethereum is no better.
- Gold is threatening to break down. It has spent three weeks trying to hold its low, and if that breaks it could go much lower.
The Aussie market: hiding in the big caps
The Aussie market has been incredibly strong, and our core has picked up the benefit. But look under the hood: it’s in a big weekly zigzag base, and the strength is in the big, defensive stocks. Investors want to be in the top 20 blue chips and aren’t taking risk.
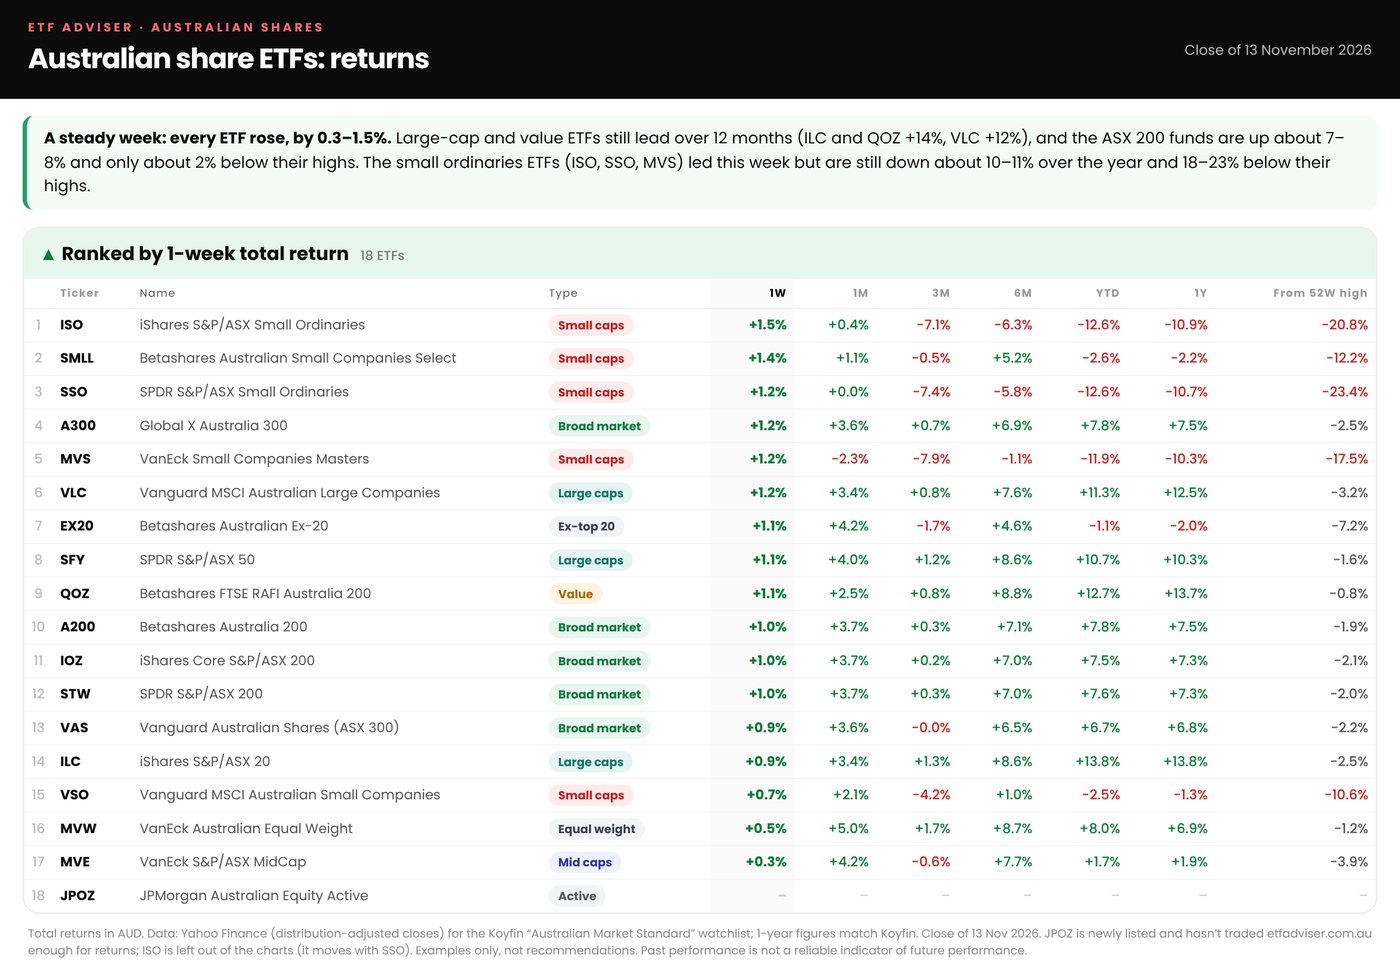
That has lifted the index, but it’s also why we don’t want our satellite portfolio invested yet. Over 12 months the top 20 (ILC) is up about 14%, while the rest of the market (EX20) is down about 2% and small caps are 18–23% below their highs.
US market: not out of the woods
Unlike IVV on the ASX, the S&P 500 itself is stuck under its moving averages. It found resistance at the 50-day average, and the best case is that it holds its recent low. It feels like it could still go lower.
It’s not unlike Trump’s first term. Usually we get a Christmas rally, but in 2018 it didn’t happen: the market didn’t bottom until 24 December, then rallied well from there. Everyone is expecting a Christmas rally, and at the moment it’s not quite showing up.
New in the members’ portal: sector rotation
We’ve just launched our new members’ portal, and one of the most useful tools is sector rotation. It shows each sector against the market, and sectors tend to move from leading to weakening to lagging to improving.
- Resources were very weak four weeks ago and are improving.
- Financials are strong, but banks are starting to weaken a little, and high dividend, which was leading, has started to underperform.
- Small caps are starting to pop up.
Overall that looks fairly positive, and we want to see it continue.
Regions, themes and commodities
Against a diversified fund like DHHF, India, a surprise leader not long ago, is weakening. Korea and Asia tech had been very weak and are turning up a little. Most regions are still bunched in the middle, and nothing is pulling through into the leading quadrant yet.
Themes are messy. In commodities, oil has gone from leading to lagging, and some commodities are creeping into the improving quadrant, but they need the US dollar to ease before they can lead. Gold miners have been a surprise packet and are one to watch.
Style rotation: Australia and global
Different investment styles work in different markets: growth, momentum, quality, or Warren Buffett-style value.
- In Australia, high dividend was leading four weeks ago and has weakened. Growth at a reasonable price is now the strongest style: people are adding to shares but don’t want to pay up for high-growth stocks. Quality is weakening, while momentum and small caps, among the worst four weeks ago, are starting to strengthen.
- Globally, growth and momentum went from leading eight weeks ago to lagging, and are now creeping back up.
There are early signs of improvement, which is why the Health-O-Meter has popped up. But everything is still bunched in the middle, and nothing is heading into the top-right “leading” corner yet.
Volatility: still in no man’s land
The MOVE index (bond-market volatility) was the first to spike, eased back, then popped again late in the week. The VIX popped and settled back, and Nasdaq volatility looks like it wants to go higher before it settles. We may need the next couple of weeks to know whether this is a market bottom.
US banks, small caps and Asia
US regional banks are holding above their moving averages, a good sign. Small caps are still on the edge. In Asia, the Nikkei is trapped under its 200-day average, and China and Hong Kong are still very weak. China’s weekly chart has been down, down, down: one of its most significant corrections in recent times, and not many people are talking about it.
Australia: financials, ILC, ATEC and OZXX
People have crowded back into financials and the top 20, and ILC (the ASX 20) is almost back at its highs. Given how uncertain the economy is, it’s remarkable the market is near highs, but under the hood there are signs it could turn.
Remember the market looks forward. ATEC fell some 40% last year, anticipating this slowdown. OZXX, the Aussie market excluding financials and resources, fell about 20% but is trying to find a base and is creeping back above its moving averages, a positive sign we’ll keep watching.
Zinc and copper
Zinc is holding up well in a nice weekly base. Copper has turned weak, and its 200-day average is acting like a magnet. If it can hold and bounce, that’s a positive; if it goes lower, the market could be in more trouble.
What we’re doing now
Our indicators are all over the shop, so we’re staying patient:
- The core stays fully invested, and it’s doing what it needs to do, helped by the weaker Aussie dollar.
- The satellite stays 100% in cash until the US risk on/off gauge improves and the key ideas come back.
- We’re watching whether the US dollar can ease, whether any market can build momentum, and whether the rotation charts show sectors moving into the leading quadrant.
The Health-O-Meter is green, but we’re remaining very cautious.
ETF Adviser Lite and Complete
Lite ($15 a month) is for investors new to ETFs: a weekly report with our key indicators, including the Market Health-O-Meter and core ETF check-up. Complete ($40 a month) adds our full weekly report, the members’ portal with the Trade Desk and sector and style rotation charts, and our model portfolios. Both include our live YouTube Q&A every Thursday at 7:45pm, and both come with a free 30-day trial.
General information only, recorded at the date shown. Market views can change quickly. Mentions of ETFs, indices and portfolio positioning are not recommendations and don’t consider your objectives, financial situation or needs. Past performance is not a reliable indicator of future performance.