- 2026 has been one rotation after another: gold, then oil, then semiconductors, then the Mag 7. Each one topped as the money moved on. Now it’s healthcare and Aussie banks.
- Gold has broken down and silver, platinum and palladium are in firm downtrends. A flush lower could set up a great buying opportunity, but it’s looking like a 2027 story.
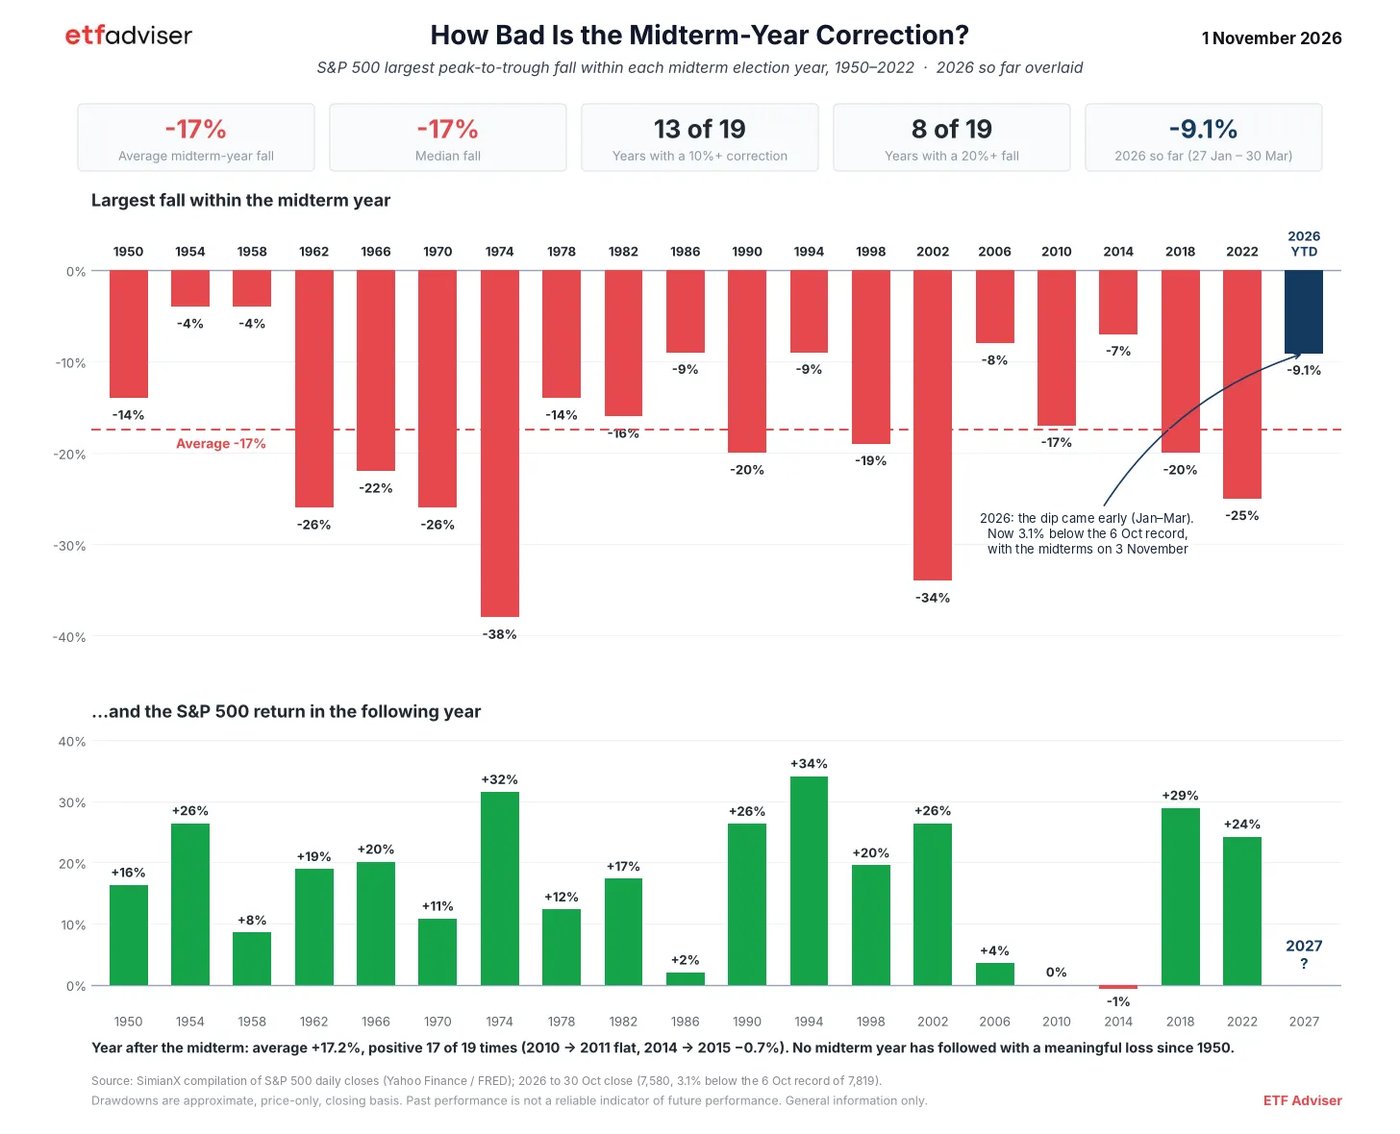
- Markets usually bottom around late October in a midterm year and rally into year end. In the year after a midterm, the S&P 500 has averaged +17% and been positive 17 of the last 19 times.
- Our signals are still red, so our satellite portfolio stays 100% cash and our focus is on the core holding its key levels.
2026 so far: one rotation after another
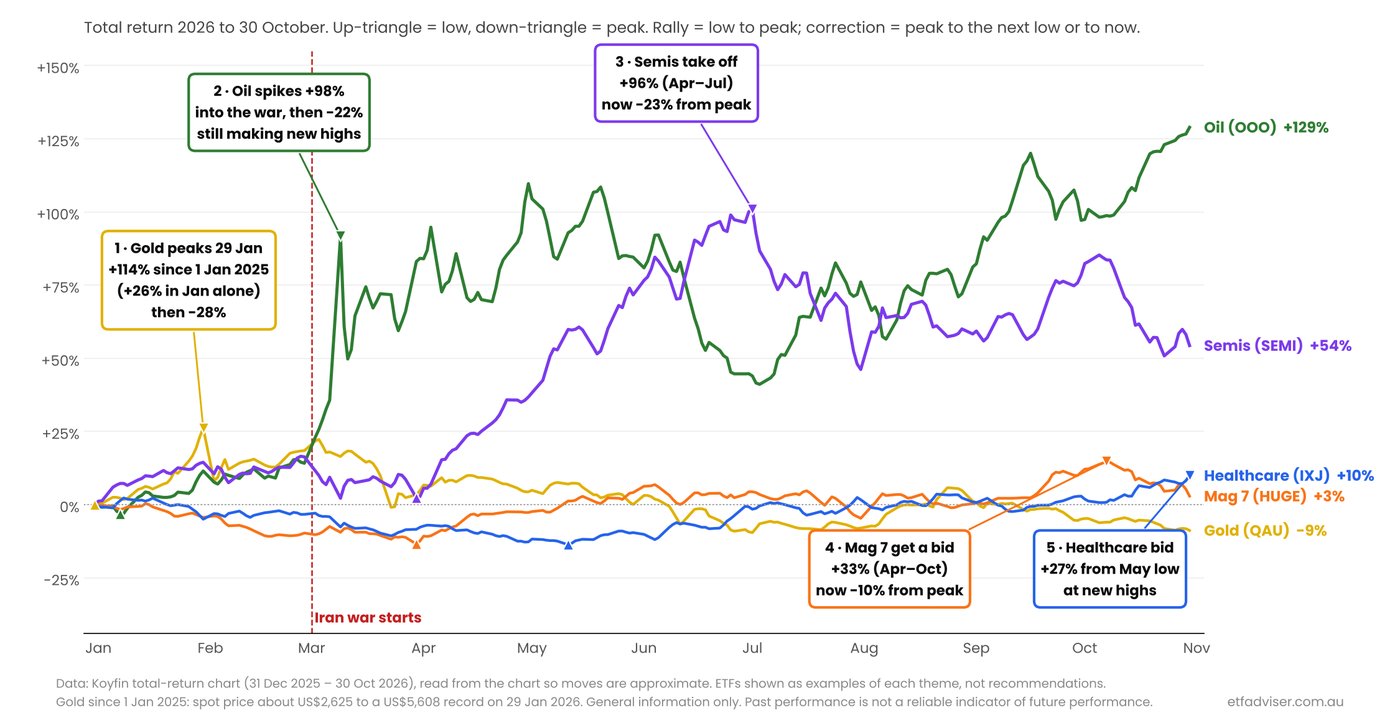
Last week Alphabet had its worst day in 22 years, down 12.6%, and Intel fell 29% in a single day. It’s the latest twist in a year where the market has jumped from one hot trade to the next:
- Gold was up 114% from 1 January 2025 to its peak on 29 January, including 26% in January alone, before falling about 28%.
- Oil spiked when the Iran war started, and is one of the best-performing assets of the year.
- Semiconductors took off soon after, up 96% between April and July, and are now 23% off their peak.
- The Magnificent 7 rallied 33% from April to October, and have fallen 10% from their peak in just the last few weeks.
- Healthcare is the latest place for money to go, up 27% from its May low.
It’s been an extremely volatile year, and very difficult to pick. That’s exactly why we let our signals decide when to be in the market and when to step aside.
The midterm election cycle: the low usually comes now
The US goes to the polls on Tuesday. Since 1928, the S&P 500 has typically struggled through a midterm year, bottomed around late October, then rallied strongly into the end of the year.
The biggest fall in a midterm year has averaged about 17%. This year the deepest fall has been 9% (late January to the end of March), and the S&P 500 is now about 3% below its October record. The year after the midterm has averaged a gain of 17%, positive in 17 of the last 19 cycles.
Will it happen this year? We don’t know. But all eyes are on the result and whether the market follows the seasonal pattern.
Our signals: still risk off
Our Market Health-O-Meter has been risk off since mid-September. There are some bright spots in Australia: the ASX 200, the ASX 20, Aussie financials and the Aussie market excluding financials and resources are all holding above their moving averages, along with global energy. But overall there’s no improvement in our risk on / risk off reading.
Our nine US risk appetite gauges give a broader picture. Six of the nine are in firm downtrends. The only bright spots: US regional banks and small caps are trying to bottom, and US volatility has risen but isn’t overly high. Some conflicting signals, but the reading stays red.
Gold and precious metals: warning signs, and maybe an opportunity
Gold has just broken below its recent low. It’s now in a downtrend, well below its moving averages, and all of those averages are pointing down. Nothing good happens under the 200-day moving average. Silver, platinum and palladium are all in firm downtrends too.
After last year’s huge run, it makes sense for precious metals to give some of it back. There’s a real risk of a flush lower, and that could set up a very good buying opportunity. For now, though, it’s looking like a 2027 story. Be very cautious.
S&P 500 and Nasdaq
The S&P 500 was down about 2% at one stage on Friday and finished down 1.82%, off its lows and into support, which is a good sign. The question is whether it needs to fall to its 200-day average or can chop around here. The Nasdaq looks weaker, slightly below its 200-day but still in a base. When in doubt, stay out: this week is about reading the data, not rushing in.
Signs of rotation
- S&P 500 equal weight: some rotation back in, though the equal-weight Nasdaq is much weaker.
- US regional banks: forming a bottom and a nice weekly base, now back above their moving averages.
- US small caps: finding a low and sitting on the 200-day average. If that holds, it’s a really positive sign.
Aussie banks and Westpac
The Aussie market is holding up well, but I wouldn’t chase it. Money has piled into the banks: the OZF financials ETF is up about 8% in a little under a month and almost back to its highs, after looking like it would break down. Westpac reports on Monday, and I don’t think the economy is playing well into the banks’ business model. I can’t see how financials stay up here.
Aussie market excluding banks and miners
The good news is some rotation. OZXX tracks the Aussie market excluding financials and resources, everything outside “homes and holes”, and it’s trying to bottom. Resources have been under real pressure, with week after week down, and only one week up. If this low holds, that’s a really positive sign, but it’s wait and see.
Copper and zinc: our commodity indicators
Zinc and copper are the two commodities we watch for a signal that resources have bottomed, and both are holding up well despite the volatility. Copper has been a leader but is extended and sitting on its 20-week average: can it hold, or does it need to visit the 200-day? Zinc has been resilient. It found buying before reaching its 200-day average, popped back above its moving averages and has a nice big weekly base.
Oil
Oil is the exception: it’s oil up, everything else down. But the move is quite V-shaped, so it’s at risk of a pullback on any positive news.
Asia: China, Hong Kong, South Korea and Japan
China is in a bear market, down about 20%, with week after week of selling. It’s one of the biggest corrections in recent times and worse than the COVID correction, which at least had some bounces. Hong Kong looks similar. South Korea, a top performer this year, needed a rest: can it hold this low? Japan looks interesting. It’s heavily weighted to high-tech manufacturing, and whether it holds its 200-day average is a key data point this week.
Europe and the UK
The euro is still weak, and money seems to be leaving the eurozone. We might get a bounce, but I’d expect the euro to fall further in 2027. The UK’s FTSE, though, is holding above its 200-day average in a nice flat base with no sign of topping out, so money may be hiding there.
Volatility
US share market volatility picked up on Friday, both the VIX for the S&P 500 and the Nasdaq 100 equivalent. Bond-market volatility, the MOVE index, was the first to spike and is now easing, which is a good sign if it continues.
Where we stand: cash is king for now
Our signals are red, so our Best Ideas satellite model portfolio stays 100% in cash, and our attention shifts to the core: making sure diversified core ETFs hold their key levels. Every week brings us closer to the point where opportunities open up, but there’s no need to rush in beforehand.
ETF Adviser Lite and Complete
Lite ($15 a month) is for investors new to ETFs: a weekly report with many of our key indicators, to help you track the market and learn how to build a portfolio and which satellites to consider. Complete ($40 a month) is usually for portfolios of $50,000 or more. It adds our roughly 90-page weekly report covering most asset classes, the subscriber-only mid-week video and our model portfolios: growth, best ideas and income. Both include the live YouTube Q&A every Thursday at 7:45pm, and both come with a free 30-day trial.
General information only, recorded at the date shown. Market views can change quickly. Mentions of ETFs, indices and portfolio positioning are not recommendations and don’t consider your objectives, financial situation or needs. Past performance and seasonal patterns are not reliable indicators of future performance.