QSML invests in 150 high-quality small companies across developed markets outside Australia. It charges 0.59% a year, has $1.6b invested and returned -1.4% over the past year. The most similar ETF is QHSM, which overlaps with it by about 99%.
📅 As at 30 September 2026: fee, size and 1-year return from the TMX Australia funds report; holdings and overlap from QSML’s published holdings as at 30 October 2026.
Is it a good time to buy QSML?
Nobody can time the market perfectly, but you can check the trend before you buy. Here’s where QSML stands right now.
Loading…
| Net flow, September | +$0m |
| Net flow, 2026 so far | −$4m |
| Average month in 2026 | −$0m |
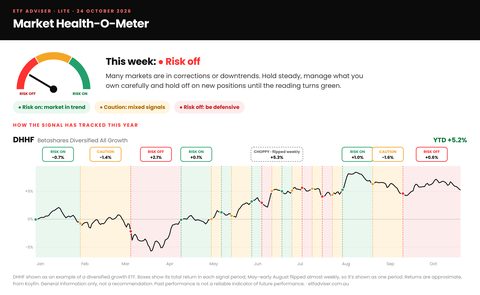
Is the whole market risk on, caution or risk off this week? Members see it every Sunday, with the core ETF check-up.
 🔒 See it free for 30 days →
QSML is in a downtrend. Some investors wait for the trend to turn before adding; others keep buying small, regular amounts. Whatever you do, size it so a further fall wouldn’t derail your plan.
General information only, not a recommendation to buy or sell QSML. Whether it suits you depends on your goals and the rest of your portfolio. Trend updated weekly; flows from the TMX Australia funds report (September 2026) and the Global X weekly market monitor. See every ETF’s trend in the ETF trend scanner, or read when to buy an ETF.
What is QSML?
Index: MSCI World ex Australia Small Cap Quality 150 Index · Issuer: VanEck · Exchange: ASX
Top 10 holdings
The 10 largest companies make up 14% of QSML.
| # | Company | Weight | |
|---|---|---|---|
| 1 | Exelixis IncHealth Care | 1.66% | |
| 2 | Manhattan Associates IncInformation Technology | 1.58% | |
| 3 | Medpace Holdings IncHealth Care | 1.58% | |
| 4 | Woodward IncIndustrials | 1.55% | |
| 5 | Royal Gold IncMaterials | 1.48% | |
| 6 | East West Bancorp IncFinancials | 1.46% | |
| 7 | ITT IncIndustrials | 1.45% | |
| 8 | Lincoln Electric Holdings IncIndustrials | 1.43% | |
| 9 | BJ's Wholesale Club Holdings IncConsumer Discretionary | 1.14% | |
| 10 | Toll Brothers IncConsumer Discretionary | 1.14% |
Sector breakdown
ETFs most similar to QSML
How much each ETF’s holdings overlap with QSML, by weight. High overlap means owning both mostly doubles up.
| ETF | Overlap | |
|---|---|---|
| QHSMVanEck MSCI Intl SML Comp Quality (Aud Hedged) ETF | 99% | Compare in calculator → |
| IJHiShares S&P Mid-Cap ETF | 20% | Compare in calculator → |
| VISMVanguard MSCI Intl Small Companies Indx ETF | 9% | QSML vs VISM → |
| ISMDGlobal X MSCI International Small and Mid Cap ETF | 9% | Compare in calculator → |
| IJRiShares S&P Small-Cap ETF | 5% | Compare in calculator → |
| PAVEGlobal X Us Infrastructure Development ETF | 5% | Compare in calculator → |
Head to head: VISM vs QSML · all comparisons
Check QSML against your own ETFs →Core or satellite?
SATELLITE Small & mid caps
QSML is a satellite: a small-company tilt that overlaps little with most global core ETFs. In our approach, satellites are bought when they break out of a base into an uptrend, kept to a small slice of the portfolio, and sold with a stop loss. Read more in core and satellite investing.
Read more: The base and trend method
QSML FAQs
Is QSML a good ETF?
QSML adds global small companies with a quality screen. Small caps have lagged large caps for some time, so it suits a satellite role. Whether it suits you depends on your goals and the rest of your portfolio.
What does QSML invest in?
QSML invests in 150 high-quality small companies across developed markets outside Australia. Its largest holdings are Exelixis Inc, Manhattan Associates Inc, Medpace Holdings Inc, and its biggest sector is industrials at about 34%.
What ETFs are similar to QSML?
The ETFs with the most overlap with QSML are QHSM (about 99%) and IJH (about 20%). Use the free ETF overlap calculator to check your own mix.
Should I own QSML and QHSM together?
Usually there is little point: their holdings overlap by about 99%, so owning both mostly doubles up.
Fee, size and returns: TMX Australia Funds Report to 30 September 2026; returns are total returns, 5-year figure is cumulative. Holdings from VanEck as at 30 October 2026. Chart: TradingView. General information only, not a recommendation to buy or sell QSML. Consider the PDS and TMD before investing.