NDQ invests in the 100 largest non-financial companies listed on the US Nasdaq exchange, which are dominated by technology. It charges 0.48% a year, has $9.5b invested and returned +16.6% over the past year. The most similar ETF is HNDQ, which overlaps with it by about 100%.
📅 As at 30 September 2026: fee, size and 1-year return from the TMX Australia funds report; holdings and overlap from NDQ’s published holdings as at 30 October 2026.
Is it a good time to buy NDQ?
Nobody can time the market perfectly, but you can check the trend before you buy. Here’s where NDQ stands right now.
Loading…
| Net flow, September | −$9m |
| Net flow, 2026 so far | +$720m |
| Average month in 2026 | +$80m |
Week to 23 October: top 10 for inflows on the ASX (+$28m).
Is the whole market risk on, caution or risk off this week? Members see it every Sunday, with the core ETF check-up.
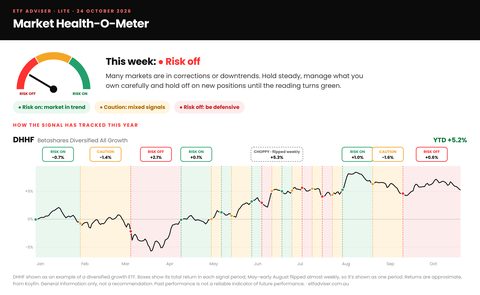 🔒 See it free for 30 days →
NDQ is in a base. Prices moving sideways can be a time to build a position gradually and watch which way the trend breaks. There’s no rush either way.
General information only, not a recommendation to buy or sell NDQ. Whether it suits you depends on your goals and the rest of your portfolio. Trend updated weekly; flows from the TMX Australia funds report (September 2026) and the Global X weekly market monitor. See every ETF’s trend in the ETF trend scanner, or read when to buy an ETF.
What is NDQ?
Index: Nasdaq-100 Index · Issuer: Betashares · Exchange: ASX
Top 10 holdings
The 10 largest companies make up 49% of NDQ.
| # | Company | Weight | |
|---|---|---|---|
| 1 | Apple IncInformation Technology | 8.18% | |
| 2 | NVIDIA CorpInformation Technology | 8.02% | |
| 3 | Microsoft CorpInformation Technology | 6.30% | |
| 4 | Alphabet (Google)Communication Services | 5.17% | |
| 5 | Micron Technology IncInformation Technology | 4.49% | |
| 6 | Amazon.com IncConsumer Discretionary | 4.22% | |
| 7 | Advanced Micro Devices IncInformation Technology | 3.70% | |
| 8 | Tesla IncConsumer Discretionary | 3.42% | |
| 9 | Meta Platforms IncCommunication Services | 2.97% | |
| 10 | Walmart IncConsumer Discretionary | 2.70% |
Sector breakdown
ETFs most similar to NDQ
How much each ETF’s holdings overlap with NDQ, by weight. High overlap means owning both mostly doubles up.
| ETF | Overlap | |
|---|---|---|
| HNDQBetashares Nasdaq 100 Currency Hedged ETF | 100% | NDQ vs HNDQ → |
| QYLDGlobal X Nasdaq 100 Covered Call Complex ETF | 96% | Compare in calculator → |
| ITEKiShares Nasdaq Top 30 ETF | 76% | Compare in calculator → |
| U100Global X Us 100 ETF | 71% | Compare in calculator → |
| V500Vanguard S&P 500 Us Shares Index ETF | 55% | Compare in calculator → |
| VTSVanguard Morningstar Us Total Mkt Shares Index ETF | 55% | Compare in calculator → |
Head to head: IVV vs NDQ · NDQ vs HNDQ · NDQ vs FANG · NDQ vs SEMI · all comparisons
Check NDQ against your own ETFs →Core or satellite?
SATELLITE Tech & AI
NDQ is a satellite: it adds a tilt to large US technology companies on top of a core. Most global core ETFs already hold these same companies, so check the overlap. In our approach, satellites are bought when they break out of a base into an uptrend, kept to a small slice of the portfolio, and sold with a stop loss. Read more in core and satellite investing.
Read more: The base and trend method · When to buy an ETF · Hedged vs unhedged ETFs
NDQ FAQs
Is NDQ a good ETF?
NDQ has been one of the strongest-performing ETFs on the ASX over the past decade, but that came from a concentrated bet on US technology. It can fall sharply in tech sell-offs, so it suits a satellite role rather than a whole portfolio. Whether it suits you depends on your goals and the rest of your portfolio.
What does NDQ invest in?
NDQ invests in the 100 largest non-financial companies listed on the US Nasdaq exchange, which are dominated by technology. Its largest holdings are Apple Inc, NVIDIA Corp, Microsoft Corp, and its biggest sector is information technology at about 58%.
What ETFs are similar to NDQ?
The ETFs with the most overlap with NDQ are HNDQ (about 100%) and QYLD (about 96%). Use the free ETF overlap calculator to check your own mix.
Should I own NDQ and HNDQ together?
Usually there is little point: their holdings overlap by about 100%, so owning both mostly doubles up.
Fee, size and returns: TMX Australia Funds Report to 30 September 2026; returns are total returns, 5-year figure is cumulative. Holdings from Betashares as at 30 October 2026. Chart: TradingView. General information only, not a recommendation to buy or sell NDQ. Consider the PDS and TMD before investing.