- Money hasn’t left the market, it’s hiding: in Aussie banks, in US shares and in the US dollar.
- Our Market Health-O-Meter and US risk gauges are risk off. Only 4 of the 17 markets we track are above their 50-day average.
- Our satellite portfolio is 100% cash. All-growth core ETFs like DHHF and VDAL are still holding above their 200-day average.
- With US earnings season peaking, a 5–10% shakeout over the next couple of weeks is possible, so stay cautious.
Your cash survey results
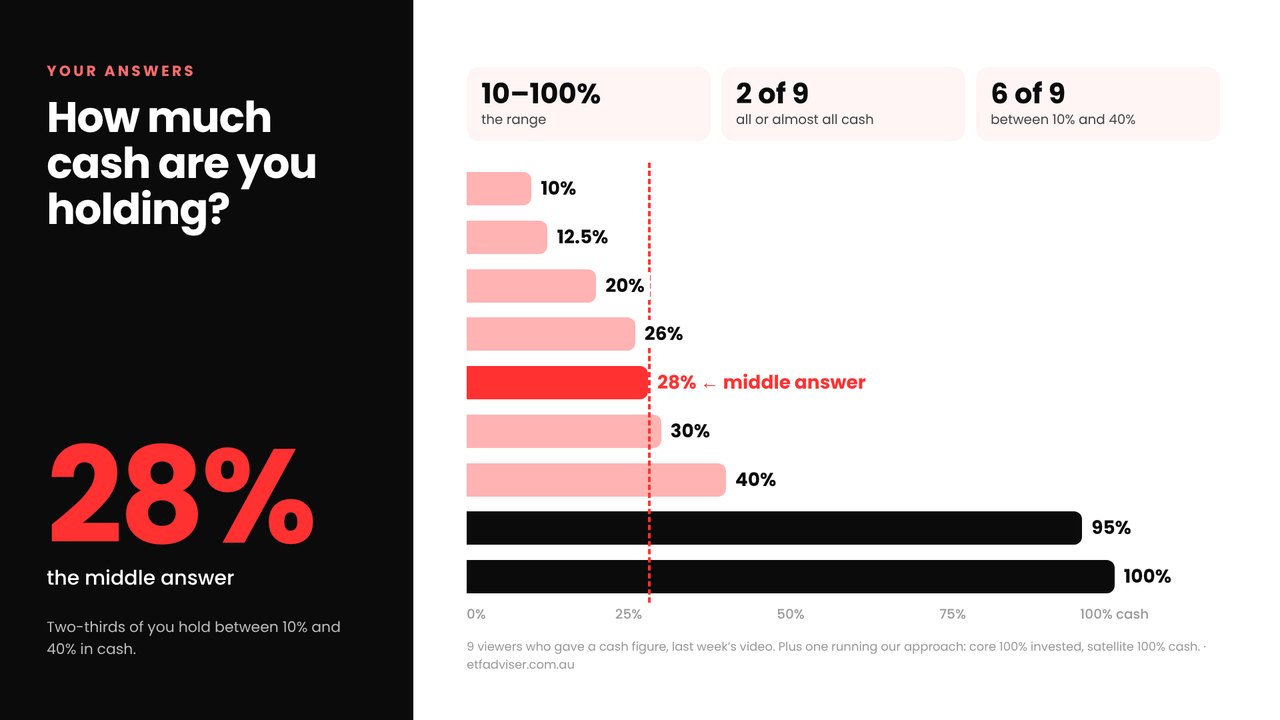
Last week I asked how much of your portfolio you’re holding in cash. The answers ranged from 10% to 100%. The middle answer was 28%, and two-thirds of you are holding between 10% and 40%. One viewer is running exactly our approach: core fully invested, satellite all in cash.
Lesson 1: you don’t need to be right most of the time
The most-liked comment last week asked about our returns. Since June last year our Best Ideas satellite model portfolio has traded 32 ETFs with a win rate of just 33%, yet it’s up 8.21%, ahead of the ASX 200 ETF on 7.64%, and now sits 100% in cash.
The reason: our average winning trade made $887 and our average losing trade cost $327. Cut losses small, let winners run, and you can be wrong most of the time and still come out ahead. Stop losses aren’t there to make you right. They’re there to keep you in the game.
Lesson 2: not every rally is a sign of strength
The Aussie market is holding in there, but it’s a battle between resources and financials. Banks have had a big defensive bid over the last couple of weeks as investors worry about global markets, resources, tech and the AI trade. Meanwhile resources are pulling back to the bottom of their base. That’s money looking for somewhere to hide, not a sign of strength.
Our signals: firmly risk off
Of the 17 markets in our Market Health-O-Meter, only 6 are above their 10-day and 20-day averages, 4 above their 50-day and 7 above their 200-day. Nothing good happens under the 200-day, and most markets are below it. Our signal history shows how well the readings have tracked the Aussie market this year: near highs when green, trending down when orange, going nowhere when red.
Our US ETF risk on / risk off measure has moved from orange to red. Almost everything we track is in a downtrend. The only gauge trying to bottom is US regional banks.
US markets, Europe and the US dollar
- Volatility: the VIX is creeping up but still mild. Bond-market volatility (the MOVE index) has spiked back to where it was when the Iran war started. If it pops further that’s bad; if it settles, that’s good for markets.
- S&P 500 and Nasdaq: both in bases, and the 200-day average has been a magnet. If the Nasdaq can’t hold its 200-day, a larger correction is possible.
- Money is hiding in the US: the euro has come off and the US dollar index is near recent highs. We want the US dollar to ease. That would signal a more risk-on environment.
Asia: Japan, South Korea and China
Japan sold back to its 200-day and found some buying on Friday. The UK bounced off its 200-day but is in no man’s land. South Korea has had three big weeks down as the AI and memory trade sold off, and China is in a bear market after relentless selling since mid-year.
Copper, zinc and oil
Copper is still holding up but is extended on the weekly chart. Zinc is holding its 20-week average, close to the 200-day. Oil is near highs and putting a dampener on our market, but it looks V-shaped and could fall fast on any positive news, so we’re not chasing it. Cash is king for now.
Signs of rotation
- S&P 500 equal weight: money is moving back in after a very weak run, though it’s a little V-shaped.
- US regional banks: trying to find a low and back above their moving averages. A good sign if it holds.
- US small caps: also trying to find a low, but not confidently yet.
- Europe: money continues to move out.
Semiconductors, gold and silver
Semiconductors finally gave up, with three big weeks down, and are trying to hold their 200-day. Silver has broken its prior low and is back in a downtrend, and gold isn’t far behind. Anything under the 200-day is a no-go zone for us. It feels like a shakeout is possible, perhaps 5–10% over the next couple of weeks, which could then form the lows. Be really cautious.
Where we stand: satellite in cash, core holding up
Our Best Ideas satellite model portfolio is 100% in cash. Our positions were stopped out one by one as the market turned.
The core is a different story. The major Australian and US markets are holding up, and so are the diversified ETFs we use as core holdings. DHHF and VDAL are well above their 200-day averages. Growth allocations are doing better because fixed interest is weighing on portfolios: VDHG bounced off its 200-day, while VDGR, with more fixed interest, is creeping below it.
US earnings season: the next fortnight matters
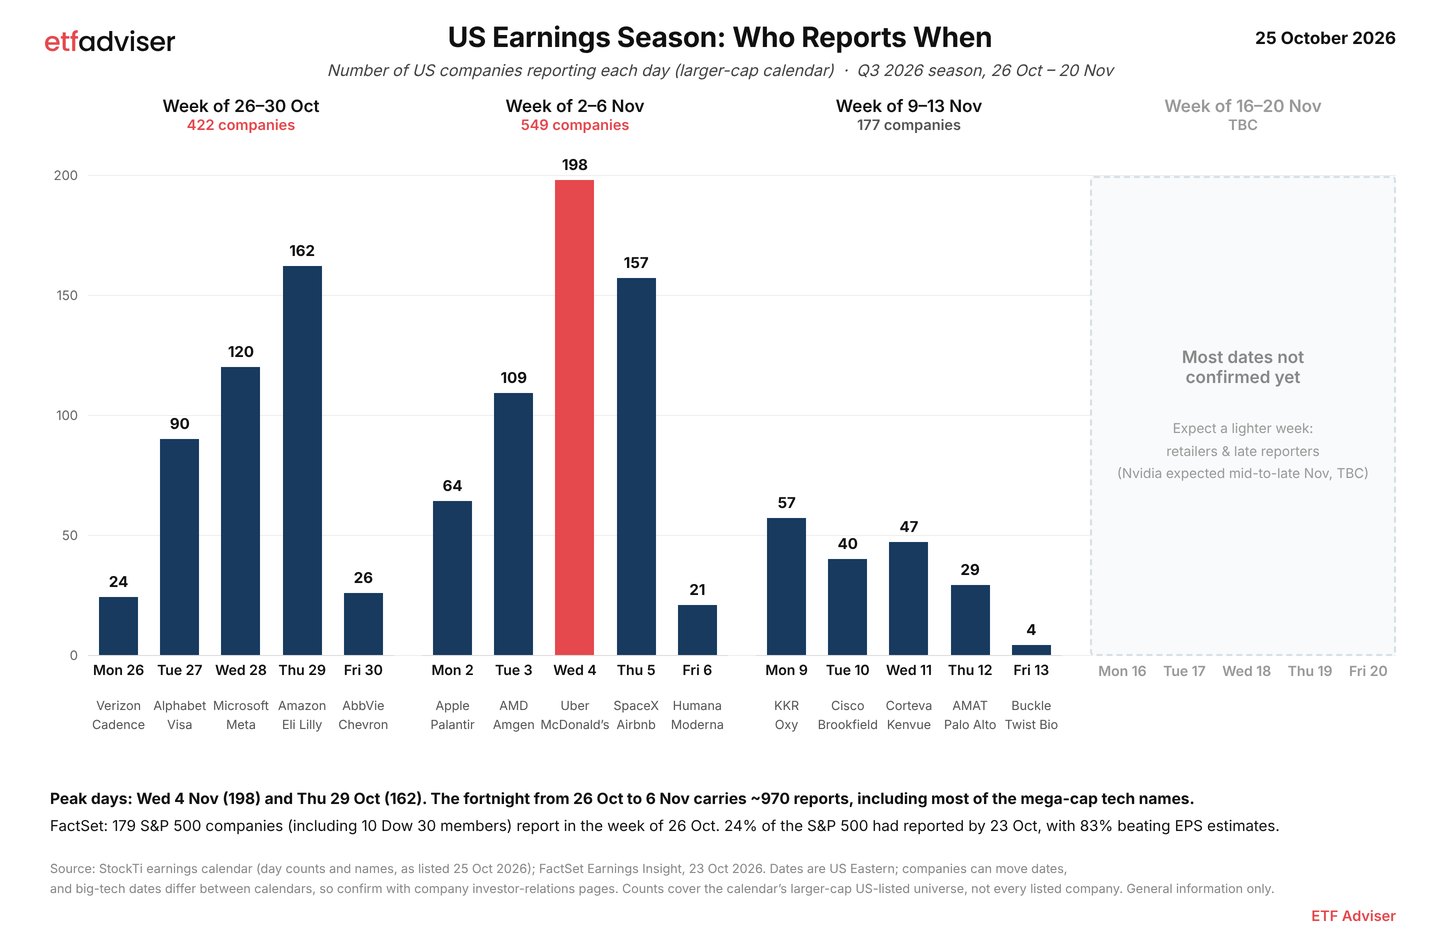
It’s not just which companies report, it’s how the market responds. So far 83% of S&P 500 companies have beaten their earnings estimates, but in a nervous market good results don’t always get rewarded. Combined with the US midterm election and seasonal patterns, the next couple of weeks could be bumpy.
The key ideas count
Not long ago we had 23 and then 20 ETF ideas a week. Then it dropped off a cliff: 3, then 1, then 1. With our indicators on red, we’re waiting for conditions to improve. When they do, the number of ideas will pick up again.
New: our website and ETF Adviser Lite
We’ve rebuilt etfadviser.com.au from the ground up, with free tools including a searchable list of every ASX ETF, ETF lists by theme and ETF comparisons.
We now have two service levels. ETF Adviser Lite is a simple weekly brief plus the Thursday live Q&A, built for beginner investors who want to learn. ETF Adviser Complete adds the full weekly report, the subscriber-only mid-week video and the model and income portfolios. Both come with a free 30-day trial.
Your turn
When you buy back into the market, will you go all in, or drip it in over a few months? Tell me in the YouTube comments. I’ll share the results next week.
General information only, recorded at the date shown. Market views can change quickly. Mentions of ETFs, indices and portfolio positioning are not recommendations and don’t consider your objectives, financial situation or needs. Past performance and seasonal patterns are not reliable indicators of future performance.